Market research · January 2024
Product and data analysts market research
NEWHR Data surveyed 464 product and data analysts. They told us how they came into the profession, how and where they look for jobs, which skills they are developing and what they are aiming for. And also how their pay has changed.
Who are all these people
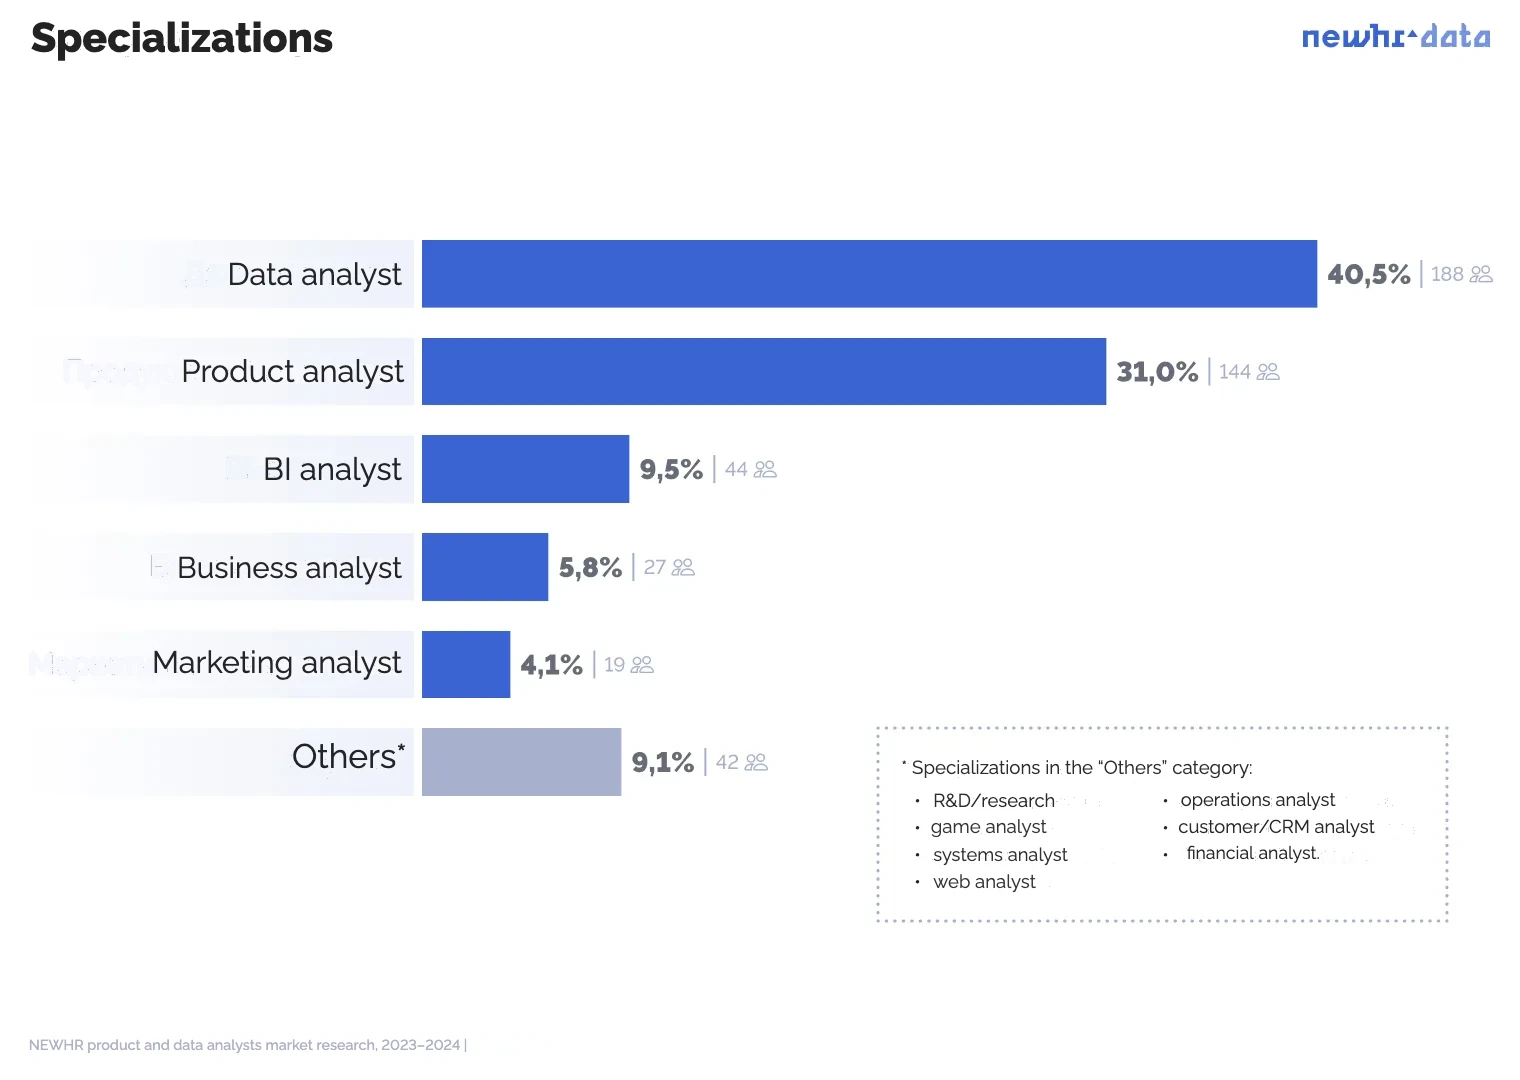
Question: How would you describe your main professional specialization in analytics?
Number of respondents: 464
The focus of the research is product and data analysts.
That said, our sample also includes people who call themselves something else: for example, "BI analysts" or "business analysts" (see the chart). We made sure that they all handle similar tasks and use similar tools.
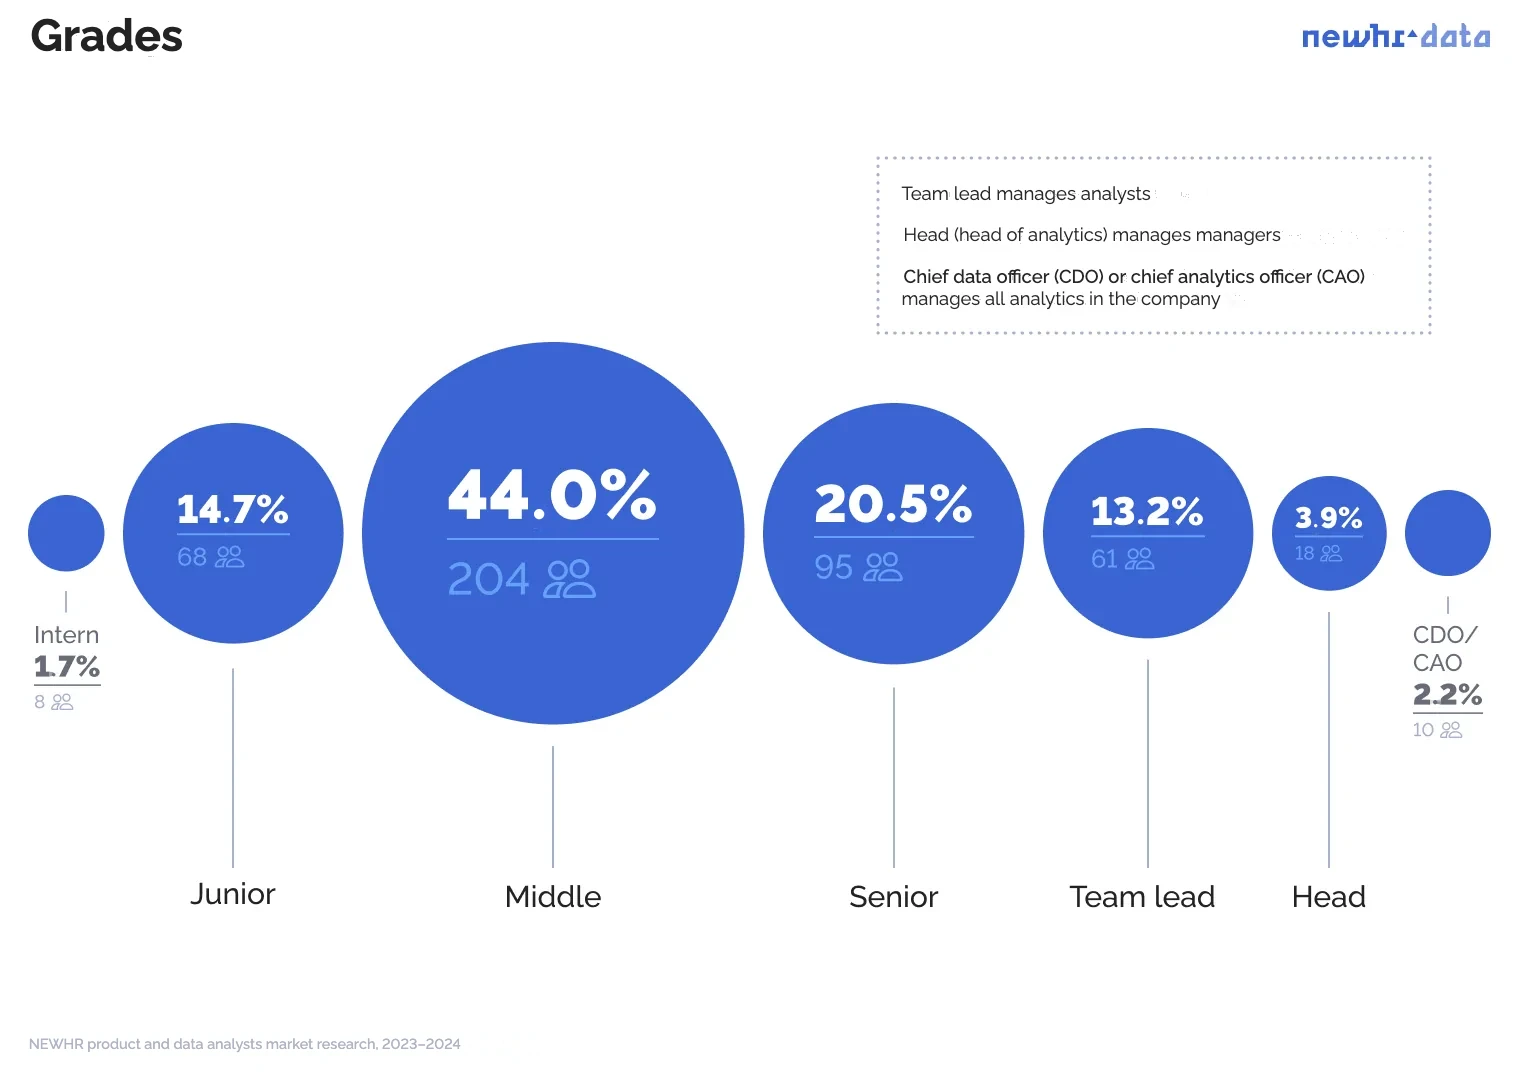
Question: What is your grade?
Number of respondents: 464
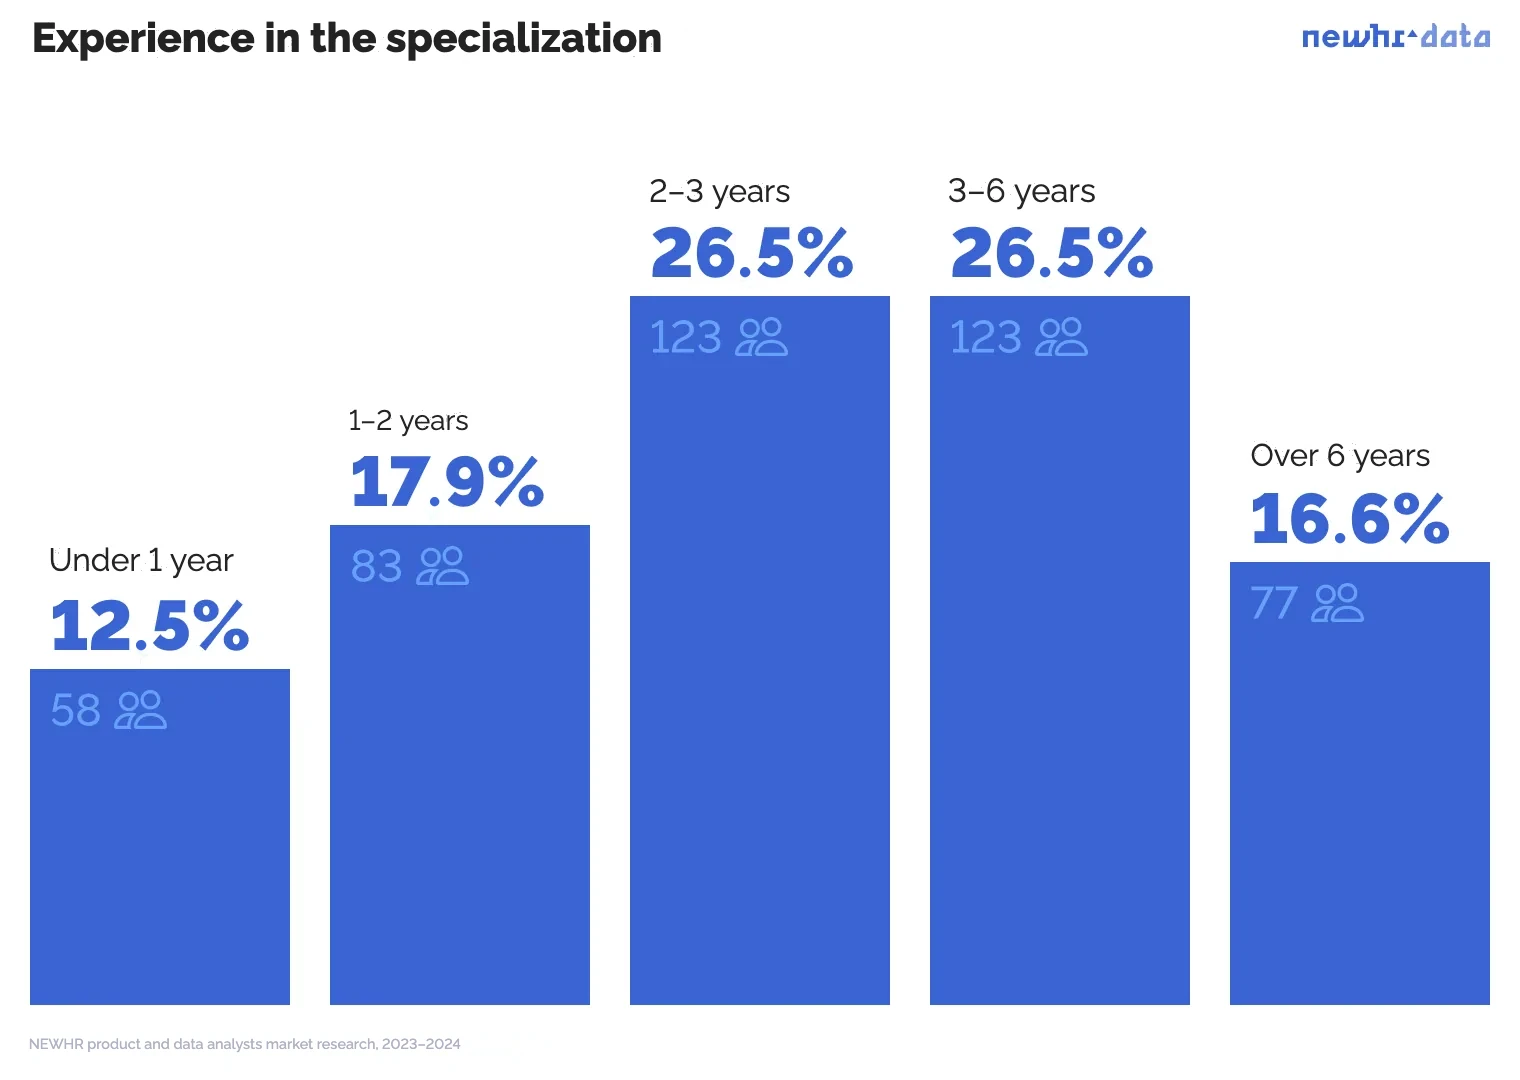
Most of our sample are experienced analysts (middle grade and above).
Question: How long have you worked in this specialization?
Number of respondents: 464
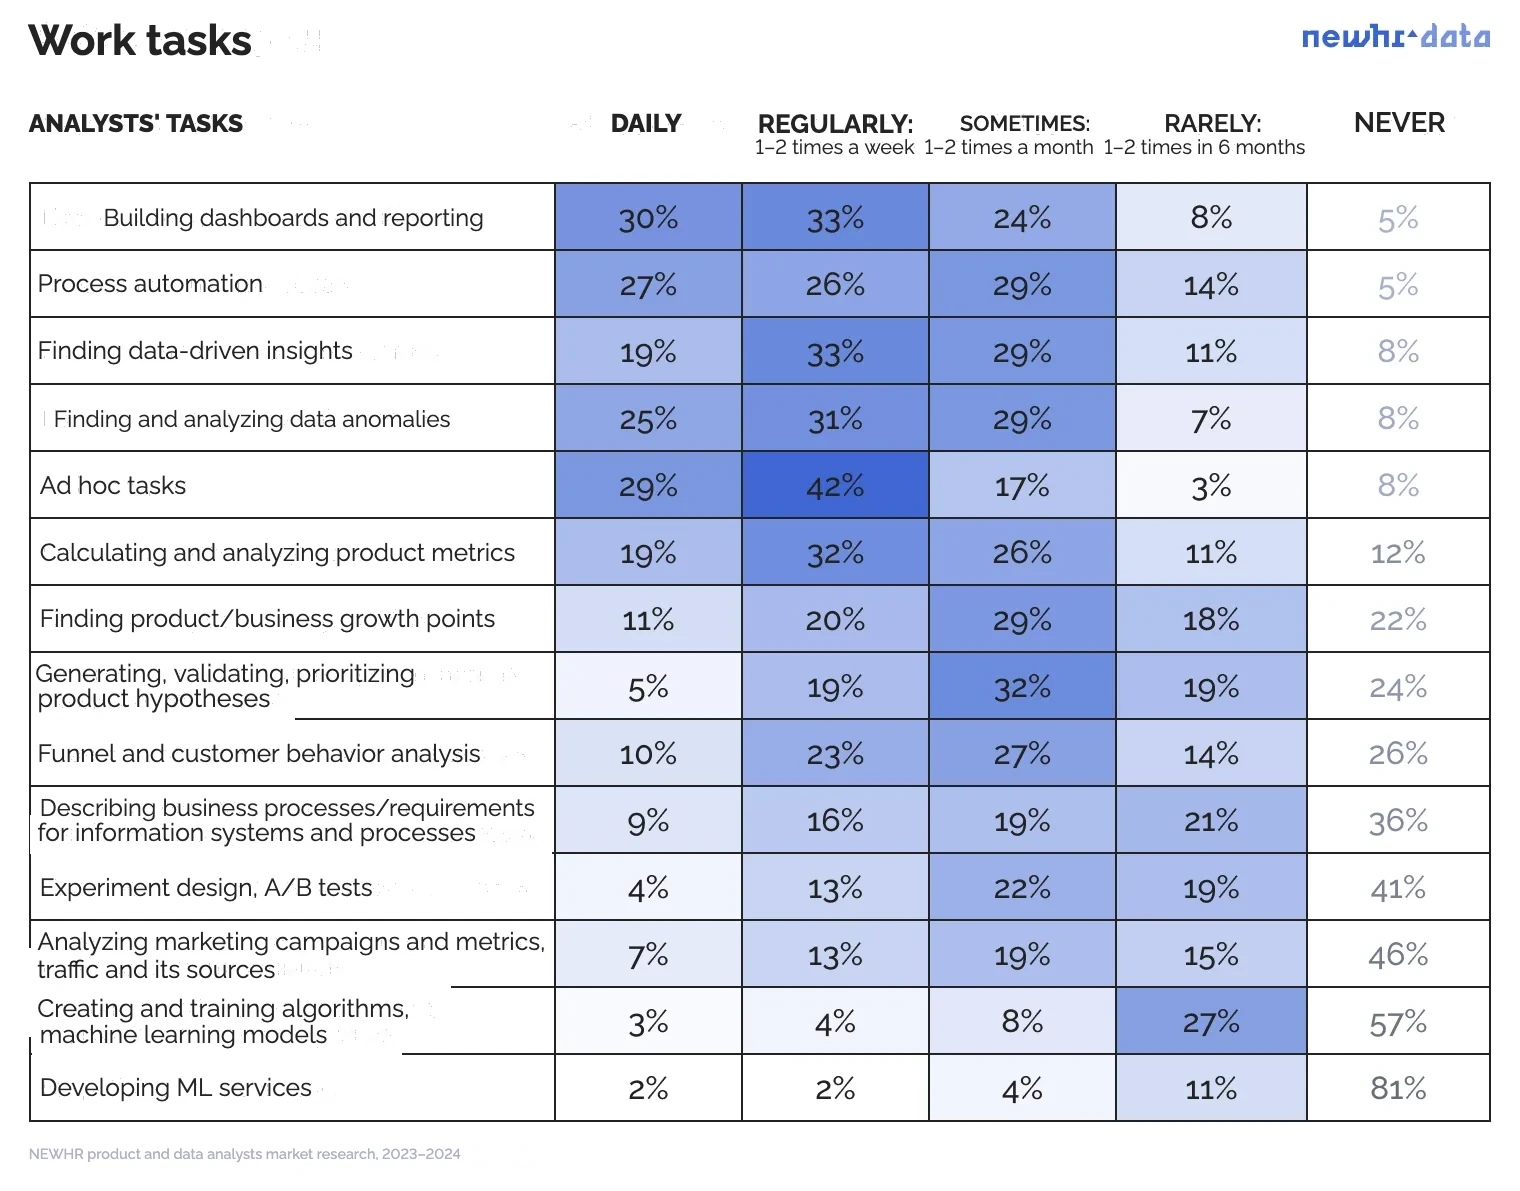
All analysts do this…
Question: What are the main analytics tasks you are responsible for?
Number of respondents: 464
The tasks of product and data analysts are quite varied.
Many respondents use machine learning tools, even though they do not consider themselves ML engineers or data scientists. In our previous research on product analysts (end of 2021), the share of those who used ML was lower.
Question: Which analytics tasks do you find the most interesting?
*Number of respondents: 464
Open question*
- Finding insights — 91 answers
- Finding insights — 52
- Finding data-driven insights — 24
- Finding insights for the business — 4
- Finding insights about the product — 2
- Finding insights in data that lead to revenue growth for the company and change the picture of the world — 1
- Finding insights for products and segments — 1
- Finding research-based insights for product development — 1
- I enjoy finding insight(s) that can quickly produce a business effect, either direct (money, revenue, profit) or indirect (customers, a feature, market share) — 1
- Finding insights to improve performance / efficiency — 1
- Finding insights based on data and product research — 1
- Finding insights based on unit economics dashboards — 1
- Finding insights that can lead to specific changes and experiments in the product — 1
- Researching the CJM to uncover insights — 1
- BI and reporting — 88 answers
- Data visualization — 21
- Creating and building dashboards — 18
- Dashboards — 9
- Building and developing reports — 7
- Building reports in BI systems — 6
- Building dashboards and reporting, choosing clear, easy-to-read visualizations — 4
- BI — 2
- BI analytics — 2
- Creating new reporting — 2
- Visualizing data in a user-readable form — 1
- Visualizing insights as storytelling — 1
- Building a clear reporting system that heads find convenient and useful to look at — 1
- Learning new BI tools — 1
- New dashboards — 1
- Breakages in reporting — 1
- Building charts — 1
- Building reports and visualizations for complex requests — 1
- Building reports and drawing conclusions from them and from models — 1
- Developing data marts and BI reporting — 1
- Building dashboards from A to Z — 1
- Making a visual and a conclusion based on it that answers the stakeholder's question and is convenient and necessary to use — 1
- Creating visual elements for a DB — 1
- Creating and developing data marts — 1
- Creating high-quality reporting — 1
- Creating reports that the target audience understands — 1
- Creating useful and beautiful reporting — 1
- Research — 64 answers
- Research — 47
- Product research — 5
- Research (for example, conversion has dropped: formulate and test several hypotheses, find out why users leave the product?) — 2
- Research and formulating recommendations, presenting the results — 2
- Quantitative research — 1
- Research with no obvious flow, when you need to go from point A, "I wonder what we have here", or "how could we develop this into a good analytical solution" — 1
- Describing research — 1
- Research tasks using NLP on a shoestring — 1
- Market research — 1
- The discovery process, when you need to dig up / find a dependency — 1
- Identifying non-obvious factors that lower service quality — 1
- Technology research — 1
- A/B tests and experiments — 57 answers
- A/B tests — 28
- Running A/B tests — 10
- Analyzing A/B tests — 6
- Testing hypotheses with A/B tests — 3
- Designing and analyzing A/B tests — 3
- A/B tests (experiment design) — 2
- A/B tests (home-made, i.e. there is no A/B testing platform) — 1
- Experiments that directly affect the result — 1
- Planning A/B tests — 1
- Non-trivial A/B tests — 1
- Quasi-experiments (propensity score, Causal Impact, diff in diff) — 1
- Working with data — 55 answers
- Data exploration, EDA — 14
- Finding patterns and relationships in data — 6
- Working with data — 5
- Collecting and analyzing data, studying data under a microscope — 3
- Data analysis — 5
- Data engineering — 2
- Setting up data processing workflows — 1
- Tasks involving spatial data and mobility — 1
- Exploratory data analysis: tracking how a given indicator changes over time — 1
- Data cleaning — 1
- Diving into user data — 1
- Preparing sources — 1
- Finding the causes of incorrect data — 1
- Finding trends in data — 1
- Building and automating data pipelines — 1
- Figuring out how to combine and present data so that changes and relationships become visible — 1
- Checking data quality — 1
- Designing data models — 1
- Designing how raw data from a source turns into accessible marts in the warehouse — 1
- Working out data models — 1
- Working with databases — 1
- Working with text data — 1
- Scraping and verifying data — 1
- Creating an effective data model and visualizing it — 1
- Analytics engineering — 1
- Data exploration (initial data analysis) — 1
- Hypotheses — 55 answers
- Testing hypotheses — 15
- Generating and testing hypotheses — 9
- Generating hypotheses — 8
- Testing product hypotheses — 7
- Generating product hypotheses — 4
- Hypotheses — 3
- Product hypotheses — 3
- Researching hypotheses — 2
- Working with hypotheses and going through possible scenarios — 1
- Exploring data to test hypotheses — 1
- Creating and testing product hypotheses aimed at growing metrics (growth hacking, roughly speaking) — 1
- Forming hypotheses based on the data obtained — 1
- ML — 50 answers
- ML — 16
- Building and developing ML models — 14
- Training ML models — 2
- Tasks that can't be done without ML — 2
- Algorithmic tasks — 2
- Deployment & observability setup (MLOps + DevOps) — 1
- ML in analytics tasks (some kind of clustering for personalization) — 1
- Analyzing the performance of ML services — 1
- Generating marketing data for products with AI — 1
- Tasks at the intersection of ML and analytics — 1
- Tasks at the intersection with ML around optimization / scaling — 1
- Research tasks using NLP — 1
- Research tasks using ML and causal inference — 1
- Training ML models and deploying them to production — 1
- Optimizing processes with new ML/AI algorithms — 1
- Pipelines — 1
- The full cycle, from defining the task to delivering an MVP of an ML service — 1
- Building predictive models — 1
- Creating and deploying ML — 1
- Growth opportunities — 47 answers
- Finding growth opportunities — 26
- Finding business growth opportunities — 9
- Finding growth opportunities in the product — 9
- Finding growth opportunities in funnels — 1
- Finding growth opportunities and then assessing them — 1
- Finding growth opportunities based on metrics — 1
- Anomalies — 42 answers
- Finding anomalies — 22
- Investigating anomalies — 8
- Investigating anomalies in data — 4
- Finding anomalies and their causes — 4
- Explaining anomalies — 2
- Finding anomalies and analyzing them — 1
- Product investigations of anomalous behavior — 1
- Customer analytics — 41 answers
- Researching user behavior — 17
- Customer journey analysis — 3
- Researching (analyzing) and improving the customer experience — 3
- Segmentation — 3
- Funnel analysis — 2
- Researching users, segments and their problems — 2
- Analyzing consumer behavior depending on changes in the product — 1
- Tasks about customer satisfaction — 1
- Researching product usage patterns — 1
- Researching the user base and how users behave in the product — 1
- Researching the product through user and system data — 1
- Researching the customer profile — 1
- Classifying the customer base — 1
- Detecting trends / interest in user activity toward a particular product — 1
- User persona — 1
- Tasks related to the behavioral traits of the audience — 1
- Formalizing user behavior into calculations (metrics) — 1
- Automation — 35 answers
- Process automation — 12
- Automation — 10
- Task automation — 2
- Reporting automation — 2
- Automating data collection and processing — 2
- Automating how information is delivered — 1
- Automating the search for gaps in analytics — 1
- Automation (the technical side specifically) — 1
- Automating calculations that used to be done by hand — 1
- Automating heavy manual reporting — 1
- Complex automation — 1
- Reducing manual processing for routine operations (connecting data, checking exports against sources, finding deviations and errors) — 1
- Finding problems and solutions — 21 answers
- Finding the causes of and solutions to various problems — 5
- Finding and explaining cause-and-effect relationships — 4
- Finding errors — 2
- Finding and developing new ideas for products, services and directions of development — 2
- Finding out why a particular marketing campaign failed — 1
- Finding the causes of outliers in the data — 1
- Finding discrepancies and aligning the process using data derived from the numbers — 1
- Finding the answer to an open question in the data — 1
- Finding solutions — 1
- Finding solutions to user problems without developing new functionality — 1
- Finding bottlenecks — 1
- Problem solving — 1
- Metrics — 16 answers
- Calculating metrics — 3
- Analyzing product metrics — 2
- Finding and creating metrics, developing metrics — 2
- Tasks that bring the maximum result in terms of product metrics — 1
- Metrics — 1
- Monitoring metric quality — 1
- Finding metrics and figures that contradict employees' ideas about the business — 1
- Finding the reason metrics dropped — 1
- Building complex success metrics for a large part of the business or the whole business — 1
- Coming up with metrics relevant to the task — 1
- Checking that metrics are calculated correctly — 1
- Developing methodologies for calculating complex metrics — 1
- Technical tasks, writing code — 15 answers
- Writing code (Python, SQL) — 5
- Writing SQL queries — 1
- Tasks at the intersection of analytics and development. I like coding. — 1
- Tasks that call for technical skills — 1
- Tasks where you can apply the most complex mathematical algorithms or complex code — 1
- Writing / structuring clean, readable code — 1
- Optimizing operations (ClickHouse/Python) — 1
- Building pipelines in Airflow — 1
- Development to the stakeholder's requirements — 1
- Creating smart algorithms in SQL — 1
- Tasks with less business and more coding and work with different data sources — 1
- Analytics — 15 answers
- Product analytics — 4
- Analysis — 2
- Fraud analytics — 1
- Predictive analytics — 1
- Almost everything in people analytics — 1
- Building end-to-end analytics — 1
- Assessing the effect of an implementation — 1
- Marketing tasks. Without marketing, even the best product can't make money — 1
- Data analysis in medicine — 1
- Analyzing the impact on business value — 1
- Real-time analytics — 1
- Business — 13 answers
- Tasks that have the strongest impact on the business or the product — 7
- Answering the business's questions and thereby influencing it — 1
- Defining KPIs for business lines — 1
- Real-time monitoring of business processes — 1
- Understanding what problem the business has, translating it into the language of data/metrics and going to dig into / solve the problem — 1
- Assessing the effect of business initiatives — 1
- Delivering growth projects — 1
- Predictive models and forecasting — 11 answers
- Forecasting — 6
- Predicting behavior based on the available data — 1
- Predicting sales under different scenarios — 1
- Predictive models — 1
- Prediction and forecasting under different scenarios — 1
- Building and choosing forecasting models — 1
- Product — 10 answers
- Product tasks — 2
- Putting together data-based proposals for improving the product — 2
- Product development — 1
- Designing the product development strategy — 1
- Building the product backlog based on data — 1
- Tasks on growing new products (startups inside a large company) — 1
- Diving deep into the product — 1
- Creating new products — 1
- Management — 8 answers
- Managing a team, leadership — 3
- Increasing team efficiency — 2
- Breaking OKRs down into solvable subtasks — 1
- Prioritizing tasks — 1
- Retaining the team — 1
- Communication — 8 answers
- Talking to business users, top management / founders — 3
- Communicating with stakeholders, clarifying tasks — 2
- Arguing with product managers =) — 1
- Explaining complex things in plain language — 1
- Storytelling — 1
- Systems and business analysis — 8 answers
- Gathering requirements — 2
- Analyzing business processes — 1
- Describing business processes (including as diagrams) — 1
- Writing up development tasks (new features) — 1
- Describing requirements and logic for functionality — 1
- Developing new business processes — 1
- Improving business processes — 1
- ETL — 7 answers
- ETL — 3
- Creating (developing) ETL processes — 3
- ETL (design + implementation) — 1
- Optimization — 5 answers
- Business optimization — 2
- Process optimization — 2
- Resource optimization: using analytical methods to optimize how resources are allocated and used. For example, optimizing logistics processes, investments or energy use. — 1
- Ad hoc — 4 answers
- Ad hoc tasks — 1
- Ad hoc tasks, where you often need to really think things through logically and approach the task in a non-standard way — 1
- Ad hoc tasks related to customer segmentation — 1
- New ad hoc requests — 1
- Processes — 4 answers
- Processes — 1
- Creating new processes — 1
- Setting up a process — 1
- Building process systems for something — 1
- Planning — 4 answers
- Planning — 1
- Planning and plan-vs-actual analysis — 1
- Building a KPI system and then doing plan-vs-actual analysis — 1
- Strategic project planning — 1
- New tasks — 4 answers
- New tasks — 2
- Non-trivial tasks with a new approach — 1
- Introducing new tools — 1
- Data-driven — 3 answers
- Introducing a data-driven approach — 1
- Building data-driven infrastructure — 1
- Developing a data-driven approach — 1
- Architecture and design — 3 answers
- Architecture — 1
- Design — 1
- Creating and changing system architecture — 1
- Mathematics, statistics — 2 answers
- Mathematical modeling — 1
- Applied statistics — 1
- Dynamic pricing — 2 answers
- Dynamic pricing — 2
Interesting tasks in respondents' own words
Spelling and punctuation preserved in the original
"The ones nobody has come up with a solution for yet, and so I invent it"
Interesting tasks in respondents' own words
Spelling and punctuation preserved in the original
"Creating order and logic out of chaos"
Interesting tasks in respondents' own words
Spelling and punctuation preserved in the original
"Sometimes, of course, it's a lot of fun to sit on a call and laugh at yet another cringe moment, but when I have no levers to change it, it drains me. If I had the levers, I'd enjoy playing at healing business processes, even at the cost of my ass being on fire"
Interesting tasks in respondents' own words
Spelling and punctuation preserved in the original
"The useful ones. I physically can't stand tasks nobody needs"
Interesting tasks in respondents' own words
Spelling and punctuation preserved in the original
"It's important to alternate between different tasks. Research ones with calculations, and sometimes you want to write code"
Interesting tasks in respondents' own words
Spelling and punctuation preserved in the original
"Tasks where the result/benefit is more tangible"
Interesting tasks in respondents' own words
Spelling and punctuation preserved in the original
"tasks that require using several tools at once"
Interesting tasks in respondents' own words
Spelling and punctuation preserved in the original
"Tasks whose results ended up affecting processes and bringing benefit in any form"
Interesting tasks in respondents' own words
Spelling and punctuation preserved in the original
"Closing a task, and making the final adjustments"
Interesting tasks in respondents' own words
Spelling and punctuation preserved in the original
"I like drawing non-obvious conclusions about people"
Interesting tasks in respondents' own words
Spelling and punctuation preserved in the original
"Finding things in the data that others don't see"
Interesting tasks in respondents' own words
Spelling and punctuation preserved in the original
"They aren't in analytics itself. They're in digging something up in the data or automating a process and having it become hugely in demand"
Interesting tasks in respondents' own words
Spelling and punctuation preserved in the original
"Answering the question of why "something" is happening. Building solid, numbers-based arguments for decisions"
Interesting tasks in respondents' own words
Spelling and punctuation preserved in the original
"Moving from analytics as an "interface to data" to analytics that helps solve business problems: not dashboards for the sake of dashboards, but tools that answer the business's questions; services that don't just handle ad hocs but address the business's pain; research and A/B tests not for the sake of process, but ones that ultimately deliver specific growth opportunities measurable in money"
Interesting tasks in respondents' own words
Spelling and punctuation preserved in the original
"Analysts developing analytics tools with their own hands"
Interesting tasks in respondents' own words
Spelling and punctuation preserved in the original
"Solving problems nobody knows how to solve"
Interesting tasks in respondents' own words
Spelling and punctuation preserved in the original
"Creating self-service analytics, where every employee can find the answer to their own question"
Interesting tasks in respondents' own words
Spelling and punctuation preserved in the original
"The ones nobody has come up with a solution for yet, and so I invent it"
Interesting tasks in respondents' own words
Spelling and punctuation preserved in the original
"Creating order and logic out of chaos"
Itchy feet
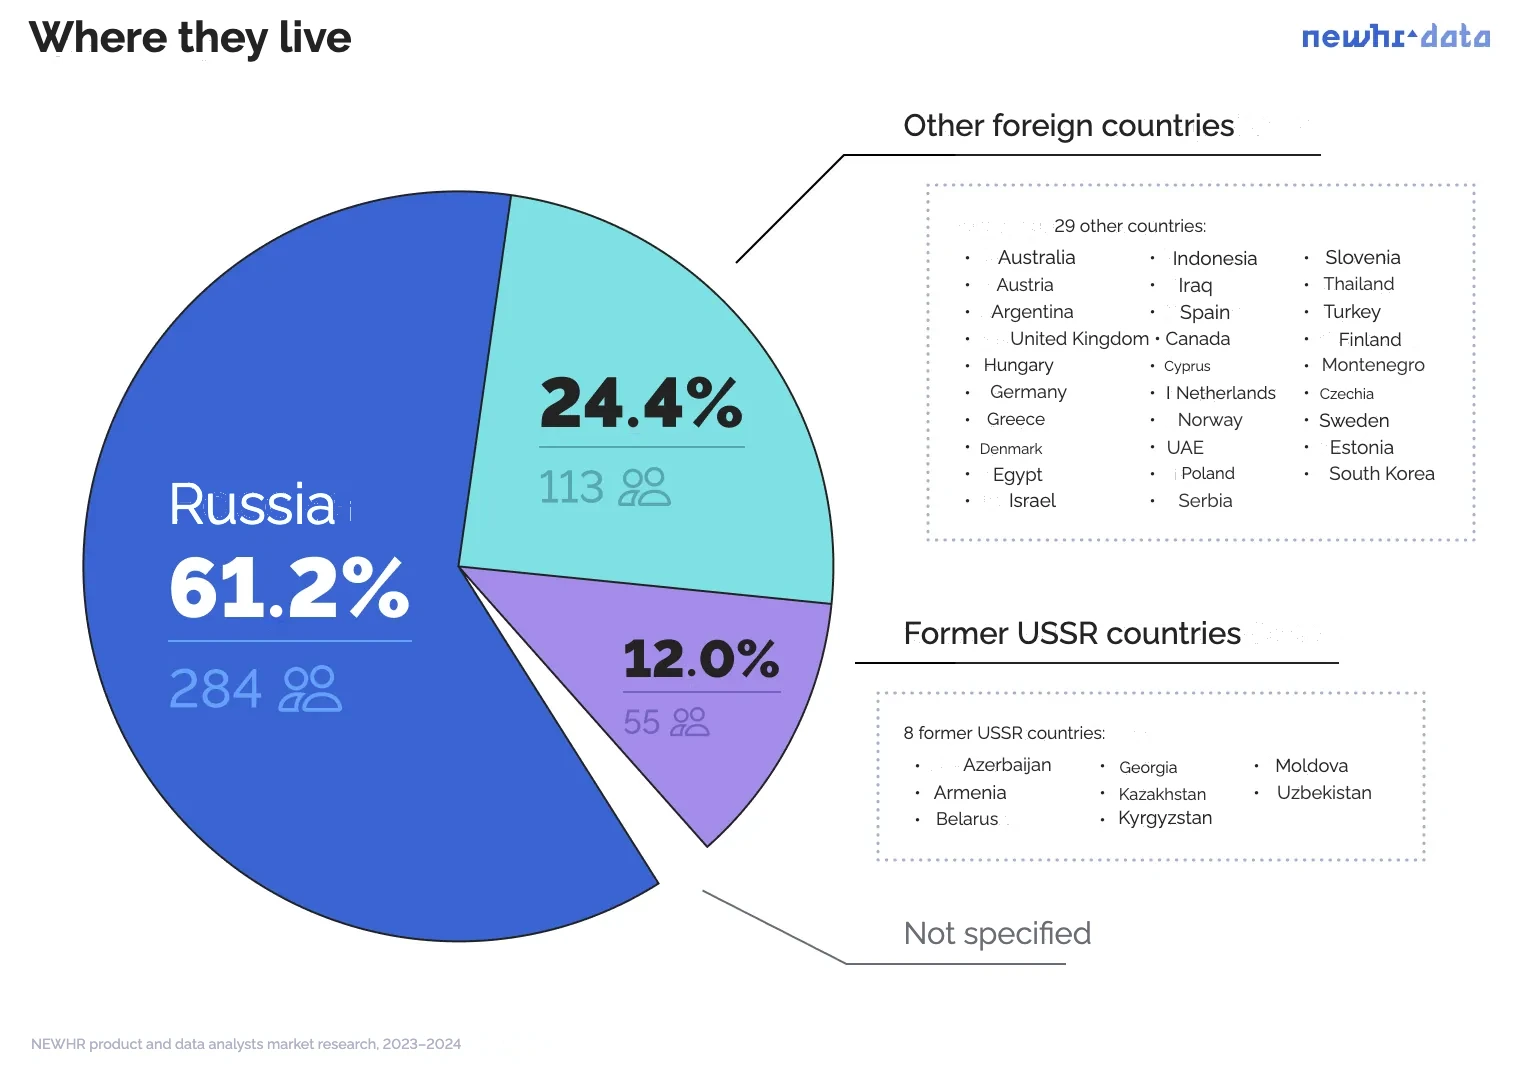
Question: Where do you live permanently / for most of the year / work from?
Number of respondents: 464
Our research reflects the views of Russian-speaking analysts living in Russia and abroad. The foreign countries mentioned most often were Serbia, Cyprus, Kazakhstan, Georgia, Armenia, Germany and Turkey.
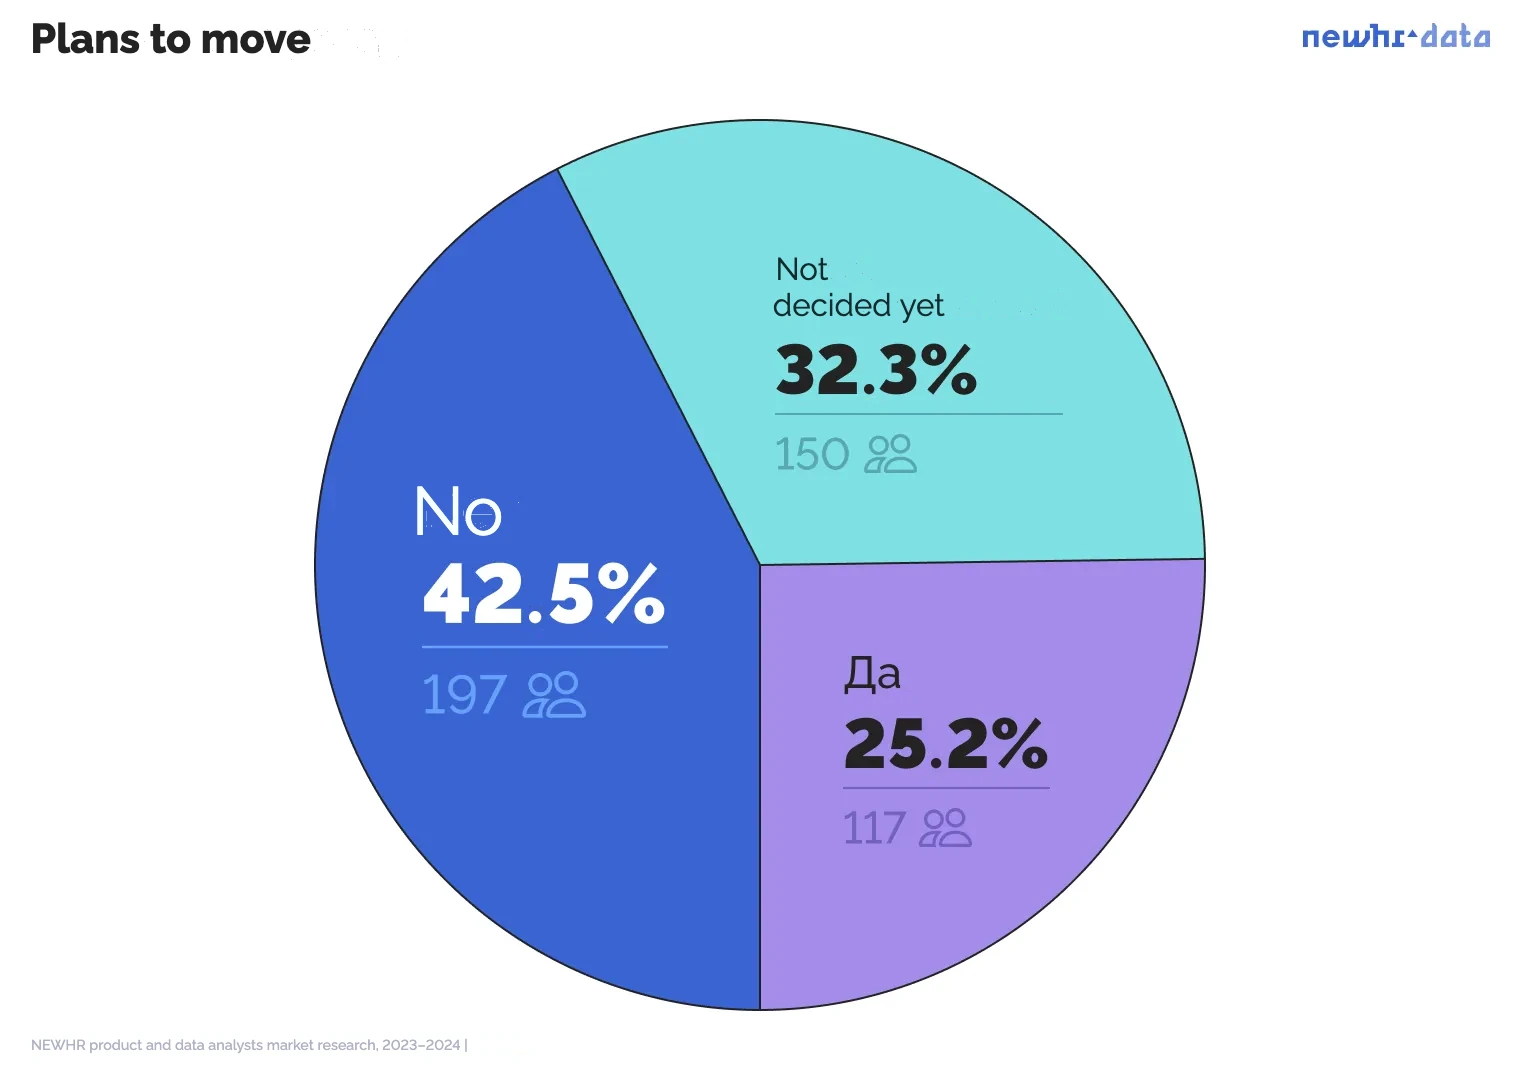
Question: Are you planning to move to another country in the next 1–1.5 years?
Number of respondents: 464
Every 4th analyst plans to change where they live. The top 5 countries analysts plan to move to: Spain, Germany, Serbia, Portugal and Canada.
Only 60% of those who want to move were able to name one specific country. The rest listed several countries, named some broad region (for example, the EU) or could not answer.
Where they work
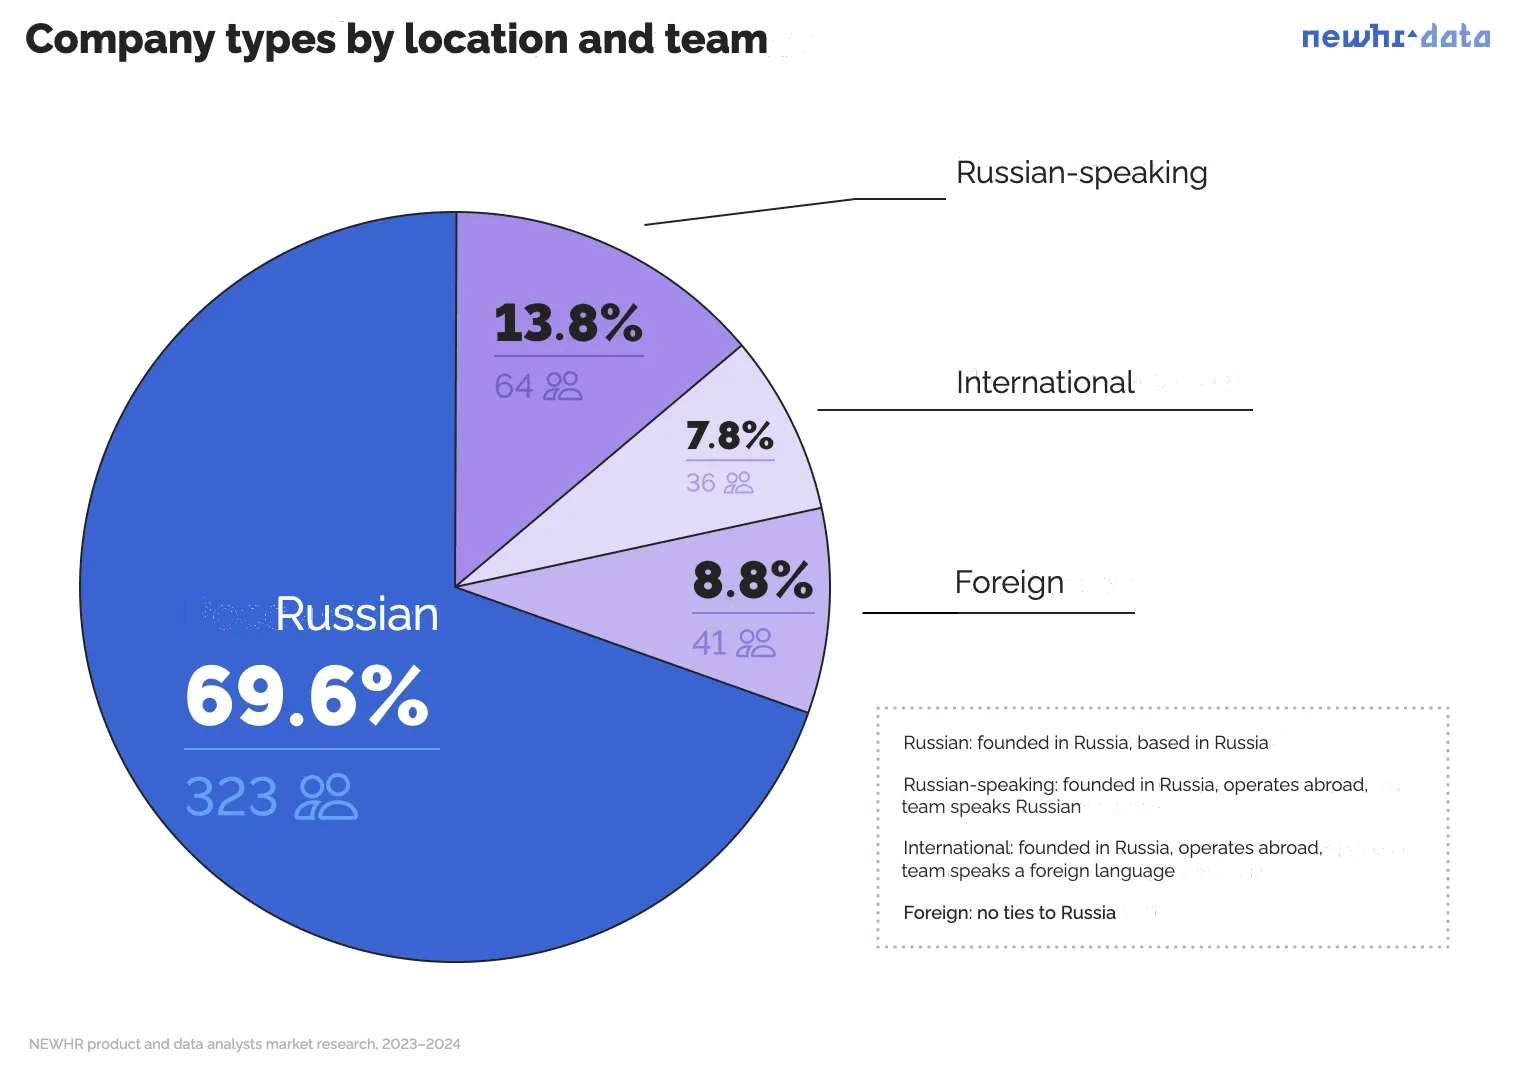
Question: Can your employer be called a Russian company?
Number of respondents: 464
Over the past couple of years the group of "partly Russian" employers has grown. These are companies with Russian roots that operate in foreign markets and whose office is outside Russia.
Such companies are popular with Russian-speaking analysts who are planning a career abroad. Working for such a company is convenient as an intermediate step for moving from the Russian IT market to the international one.
- A familiar culture.
- Russian in the team or a Russian-speaking community of colleagues makes integration easier. After all, the key skill for a product analyst is communicating with the product team.
- It is easier to get hired. Whereas at purely foreign companies you have to compete on equal terms with candidates from all over the world.
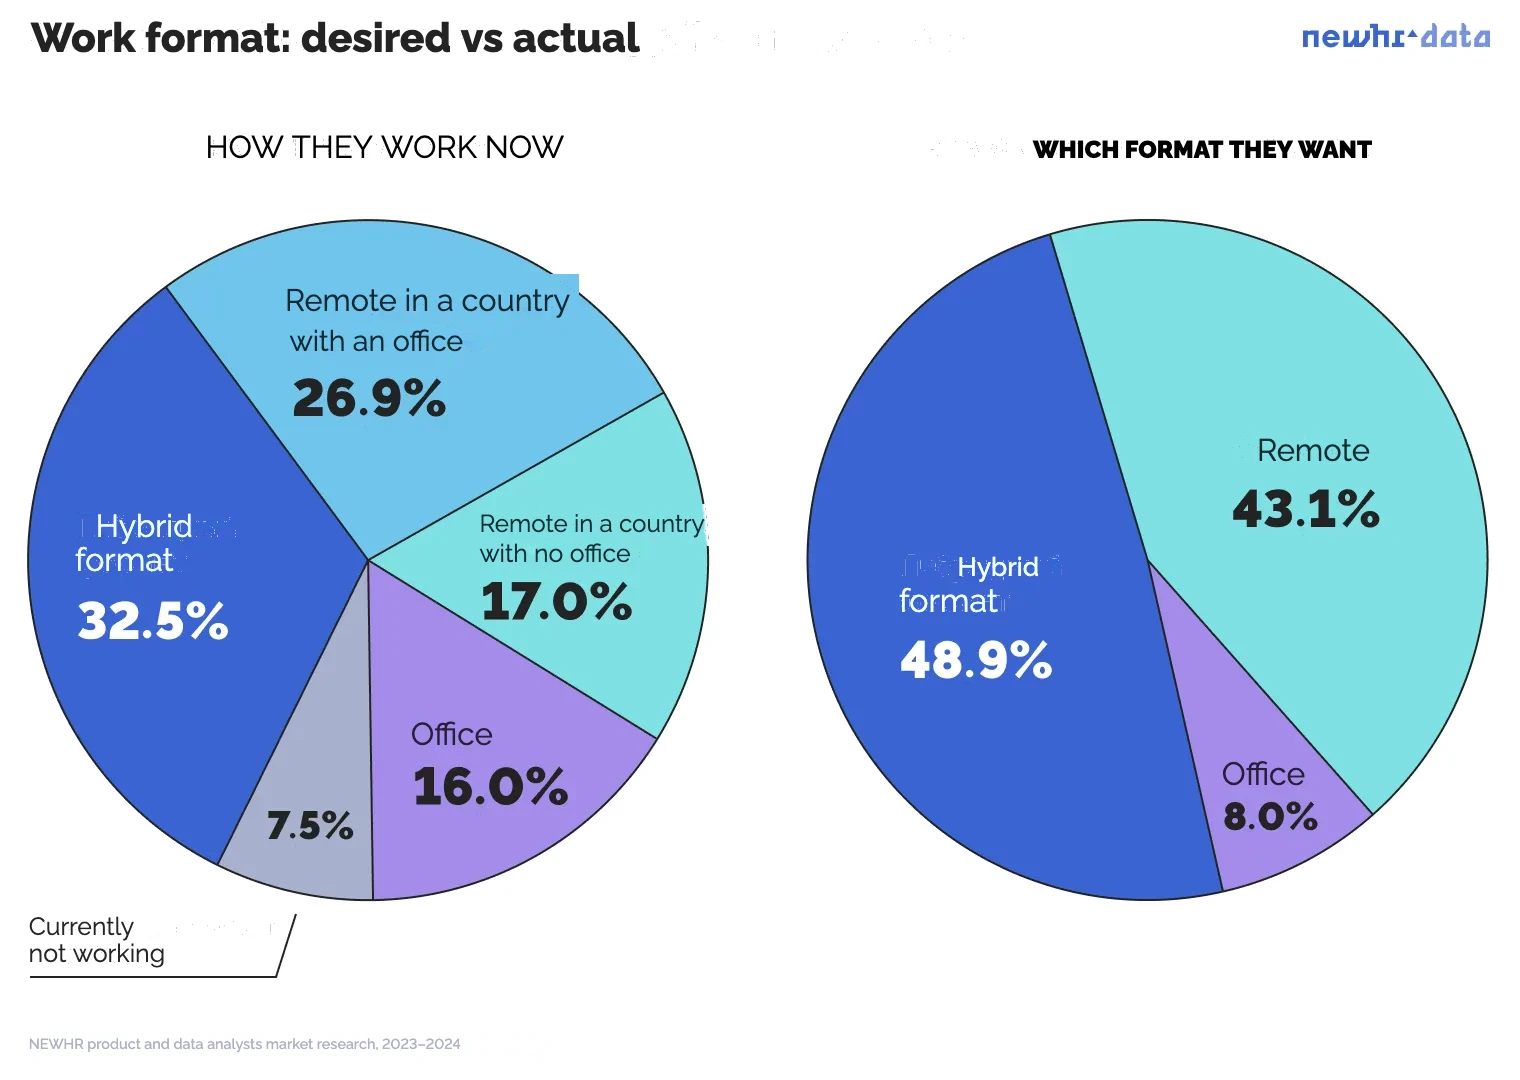
Question: What is your work format?
Number of respondents: 464
Question: Which work format do you prefer?
Number of respondents: 464
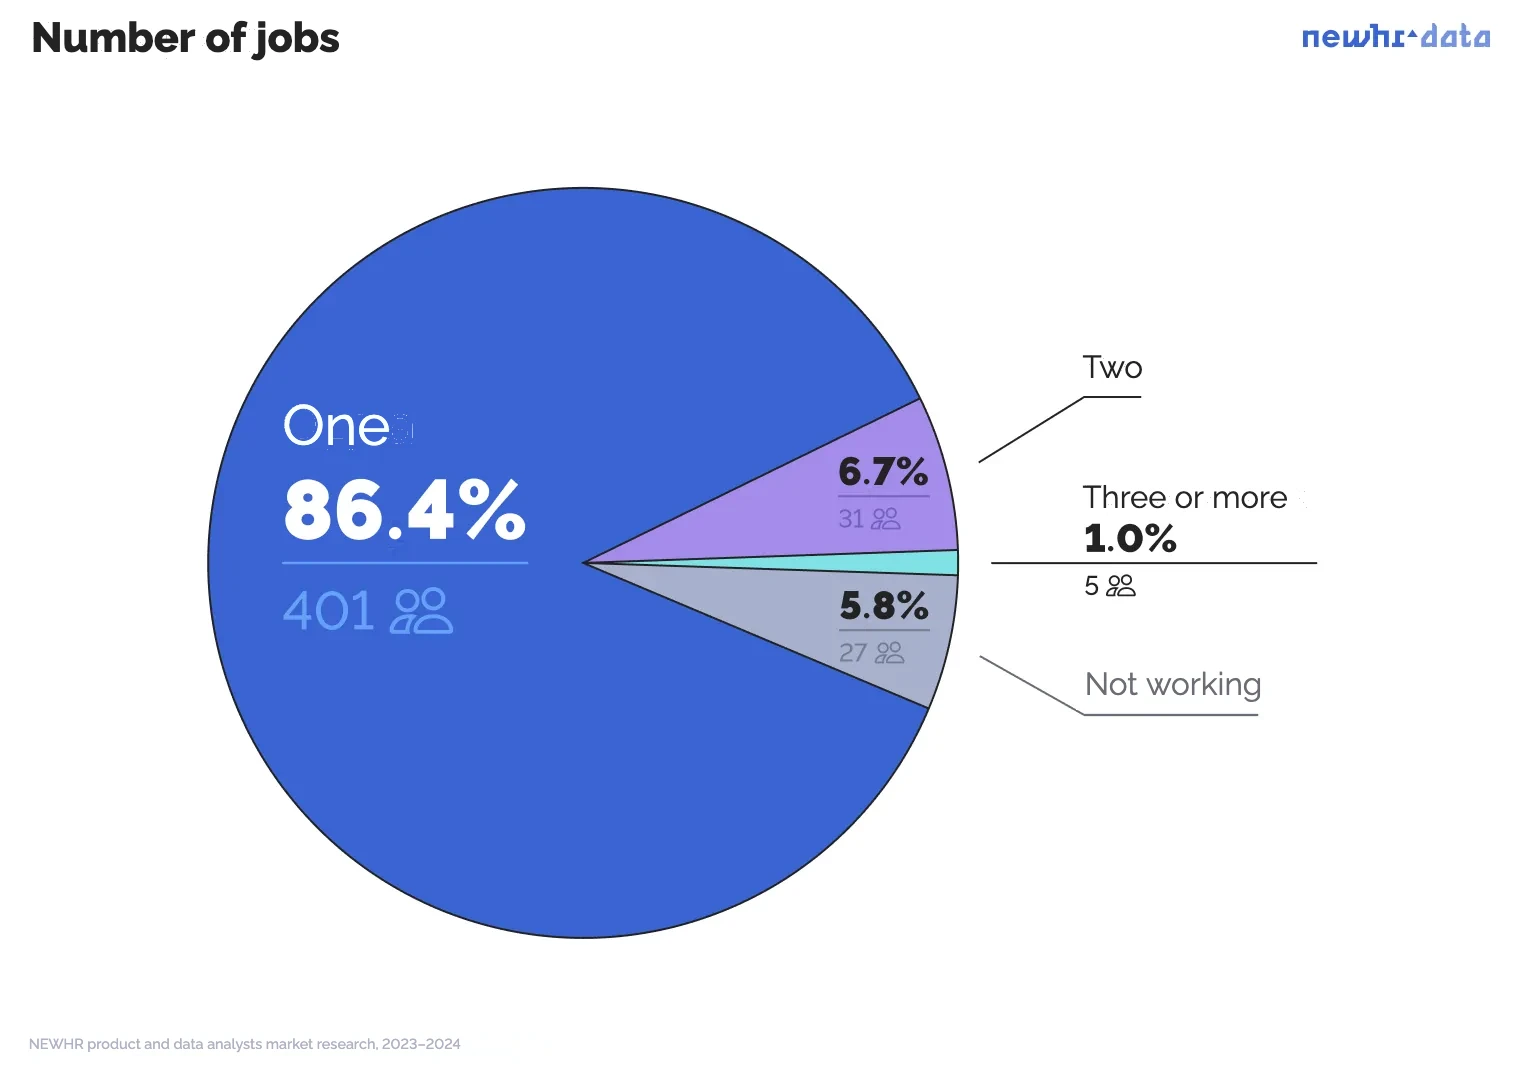
Question: Do you work for one employer or combine work for several employers?
Number of respondents: 464
Analysts have become more likely to work for two or more employers, a comparison with our 2021 research shows.
About money
Question: How did your salary change in 2023?
Number of respondents: 464
Question: How much did your salary go up over the past year?
Number of respondents: 304
Question: How much did your salary go down over the past year?
Number of respondents: 15
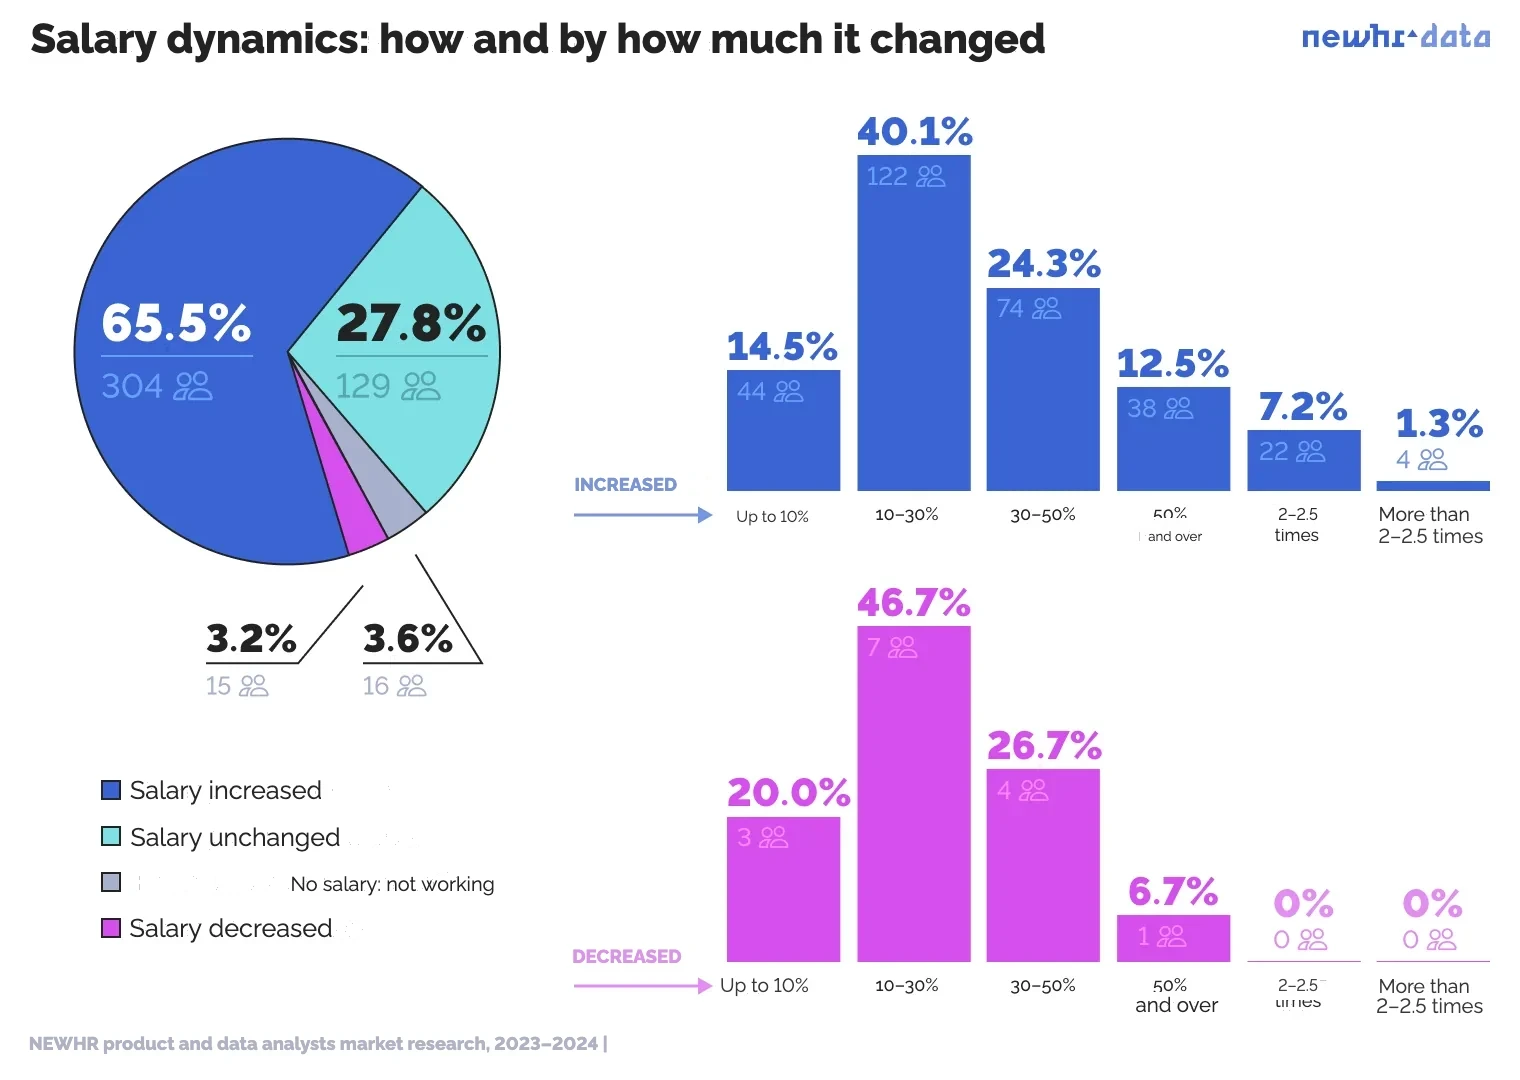
- The most dynamic income changes last year were among analysts working at partly Russian companies with an international team. In this group a larger share reported a pay rise (78%) or a pay cut (6%). And there were fewer people whose salary did not change at all (17%).
- Purely foreign companies turned out to be the most stable for analysts. They had the least growth (56%) and the fewest pay cuts (2%), and most often pay did not change at all (37%).
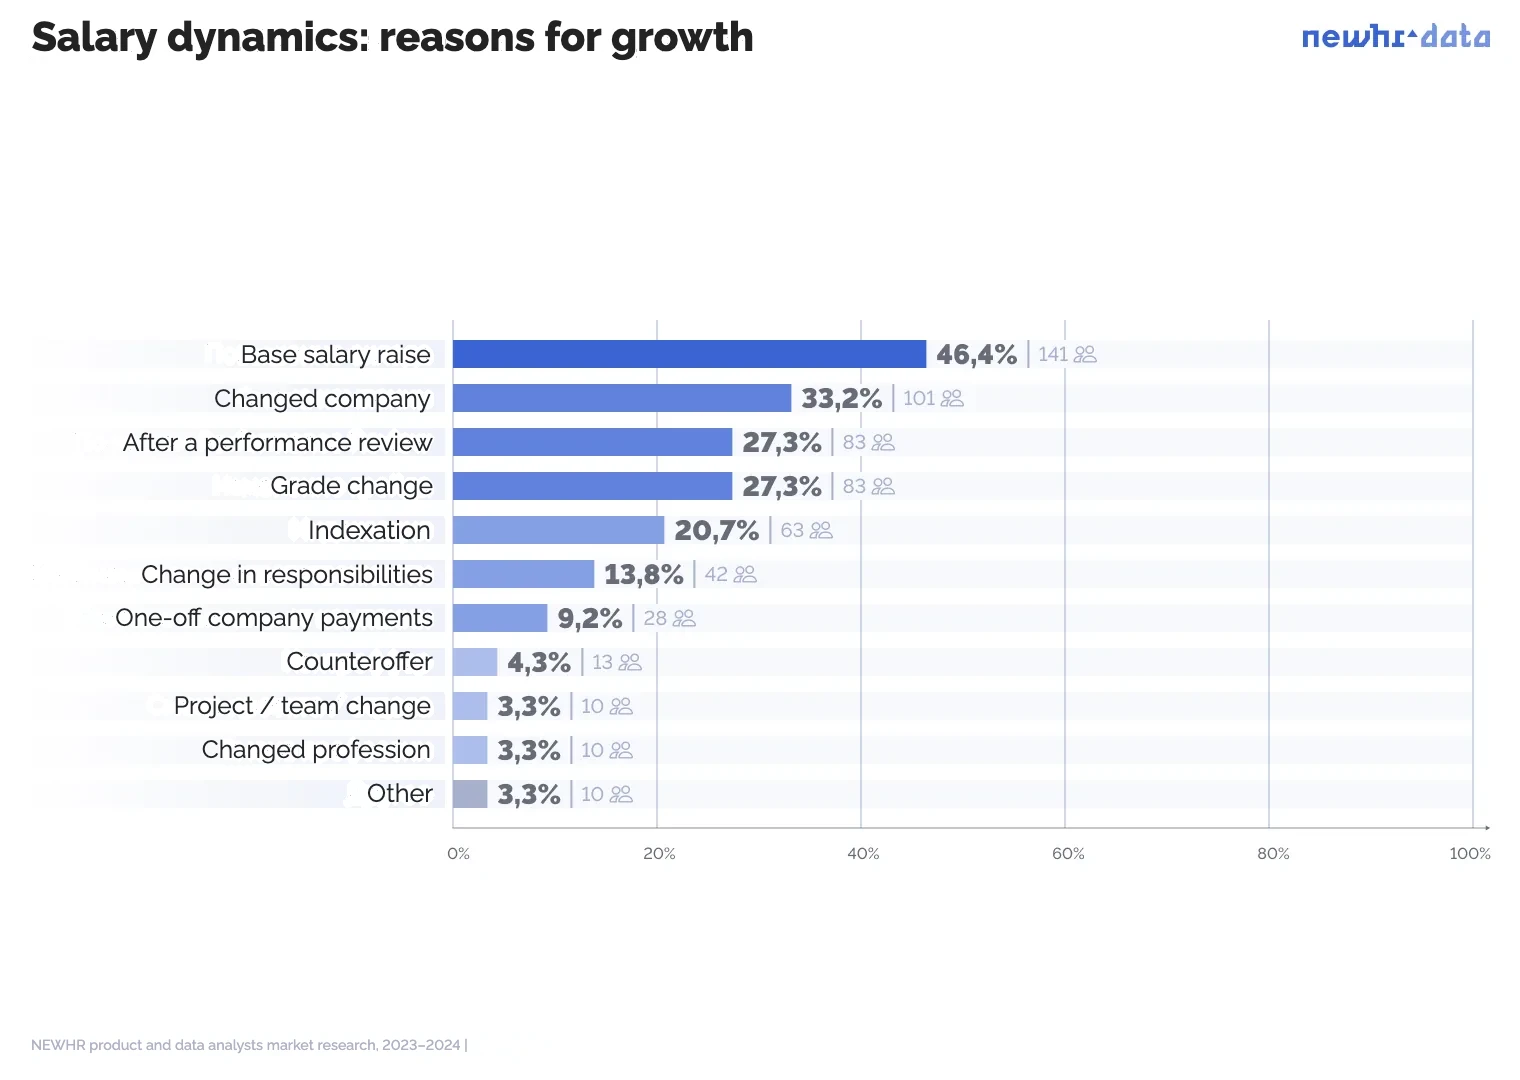
Question: What drove your salary increase?
Number of respondents: 304
Question: In what currency are you paid?
Number of respondents: 464
Compared with 2021, the variety of currencies has grown, and so has the weight of the eurozone. Three years ago a larger percentage was paid in dollars and a smaller one in euros than now.
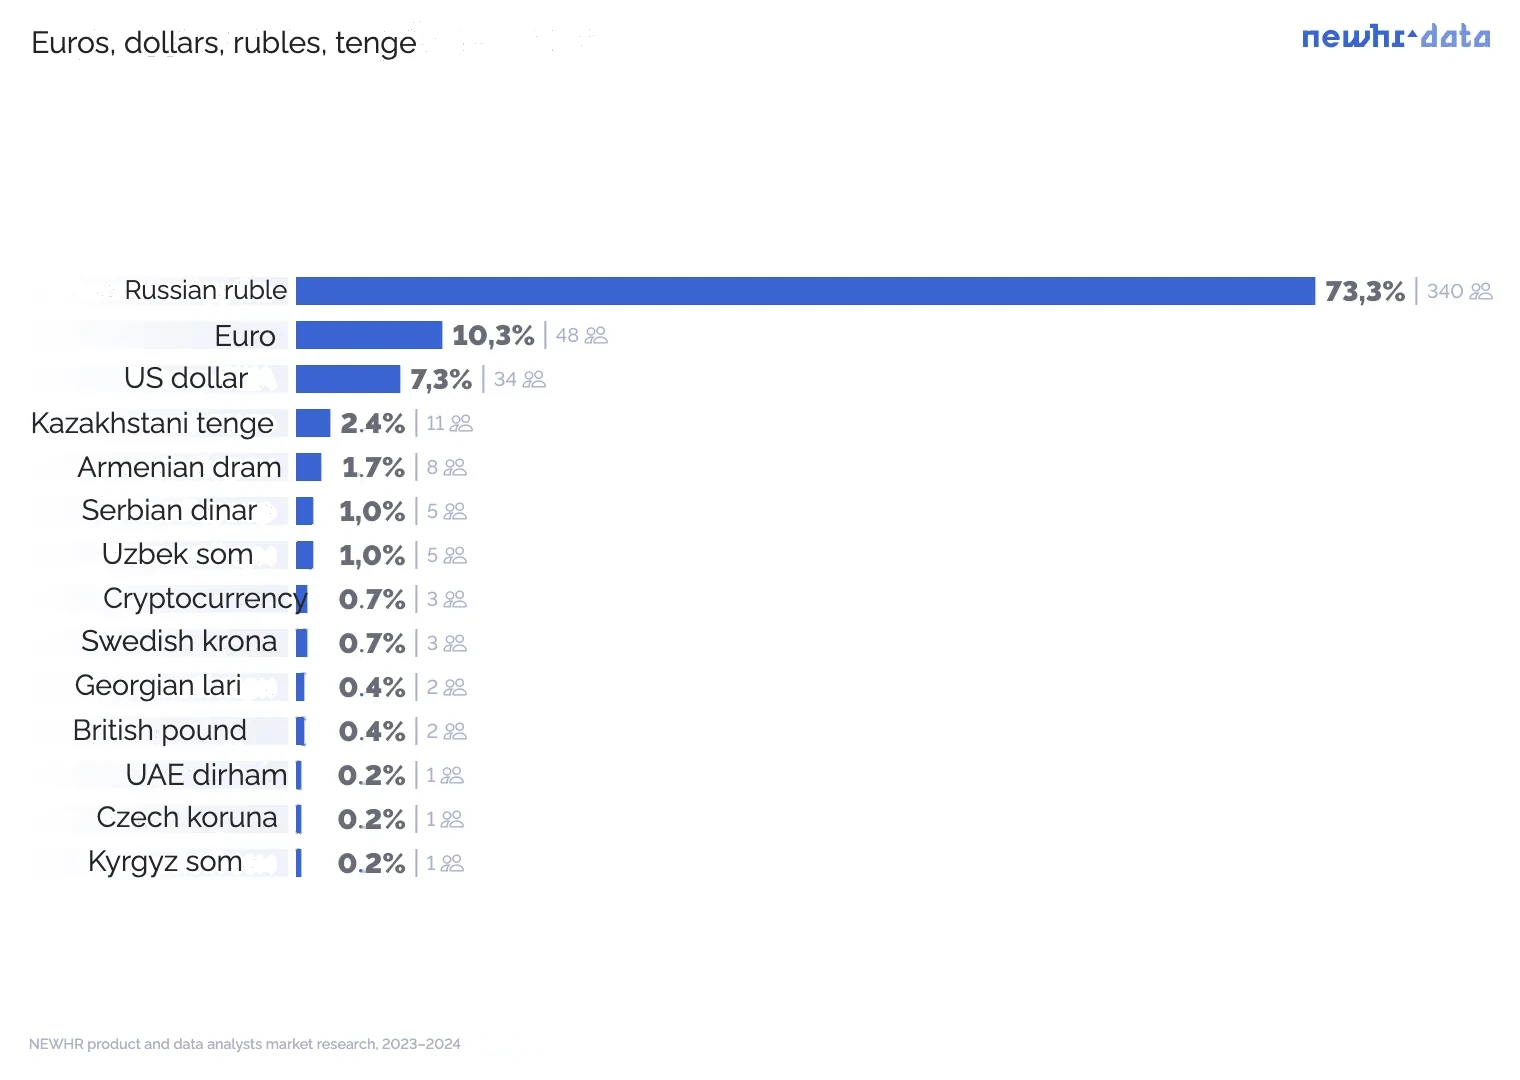
- 6% of respondents from Russian companies are not paid in rubles: 2 respondents are paid in dollars, 4 in euros, and another 14 in other foreign currencies.
- Every third employee of "partly Russian" companies is still paid in rubles despite being located abroad. 10% of analysts from purely foreign companies are also paid in the Russian currency.
Career
Question: Have you always worked as an analyst, or did you come from another profession?
Number of respondents: 464
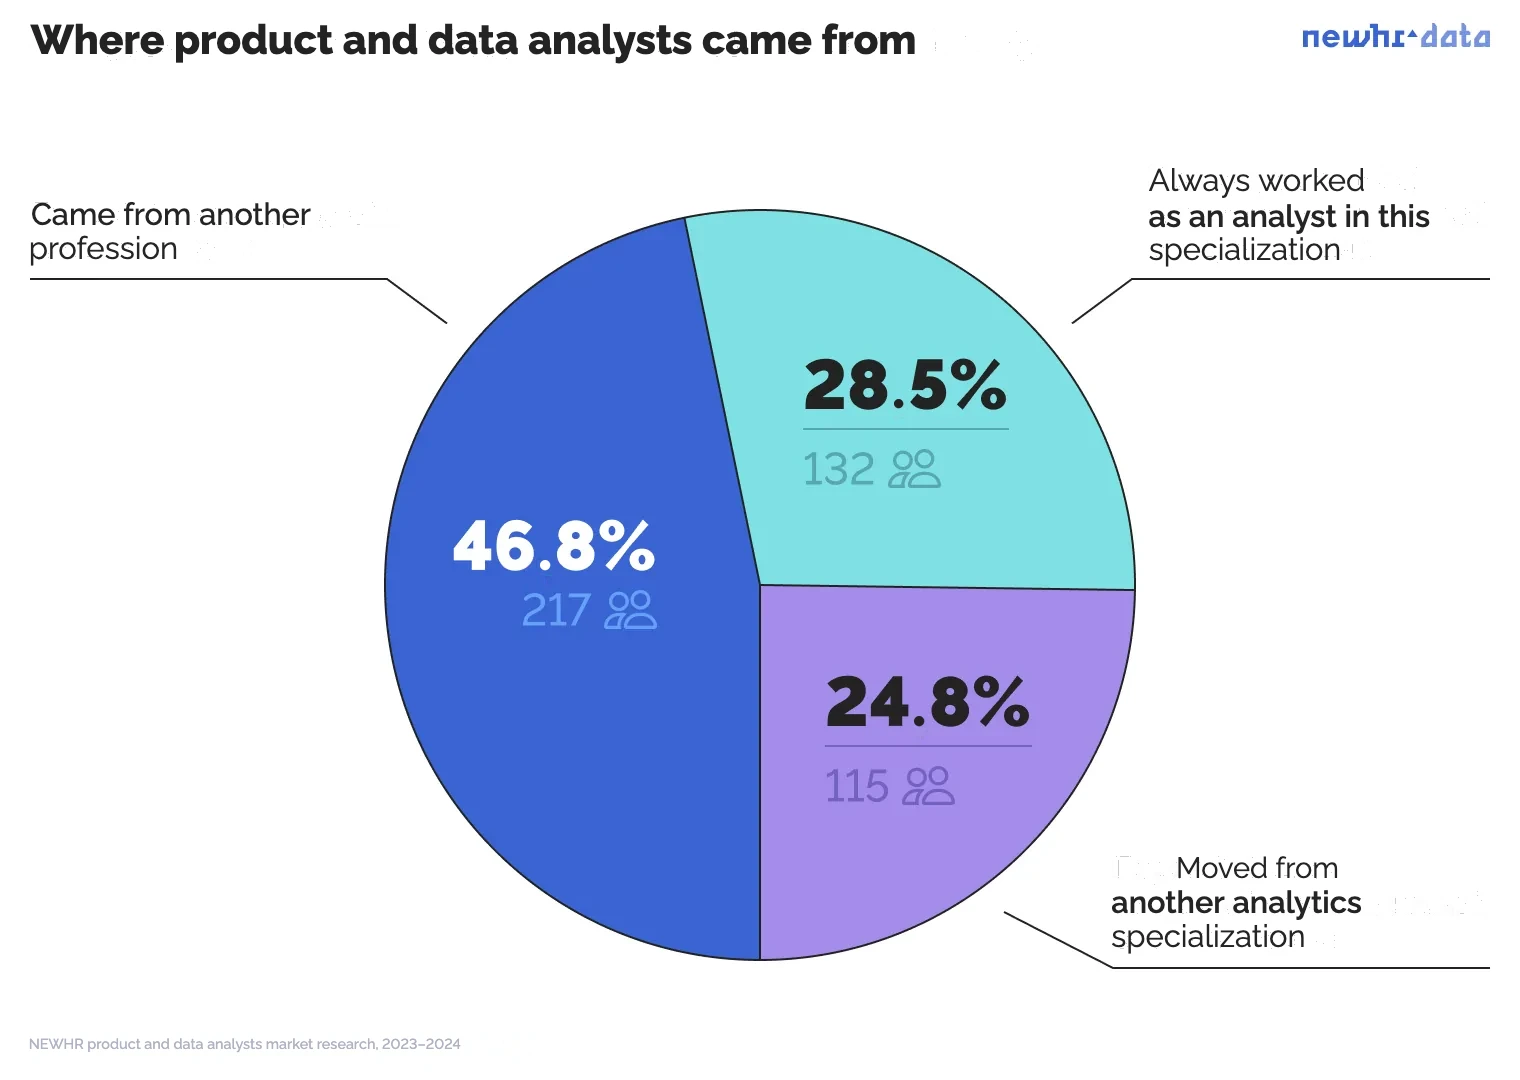
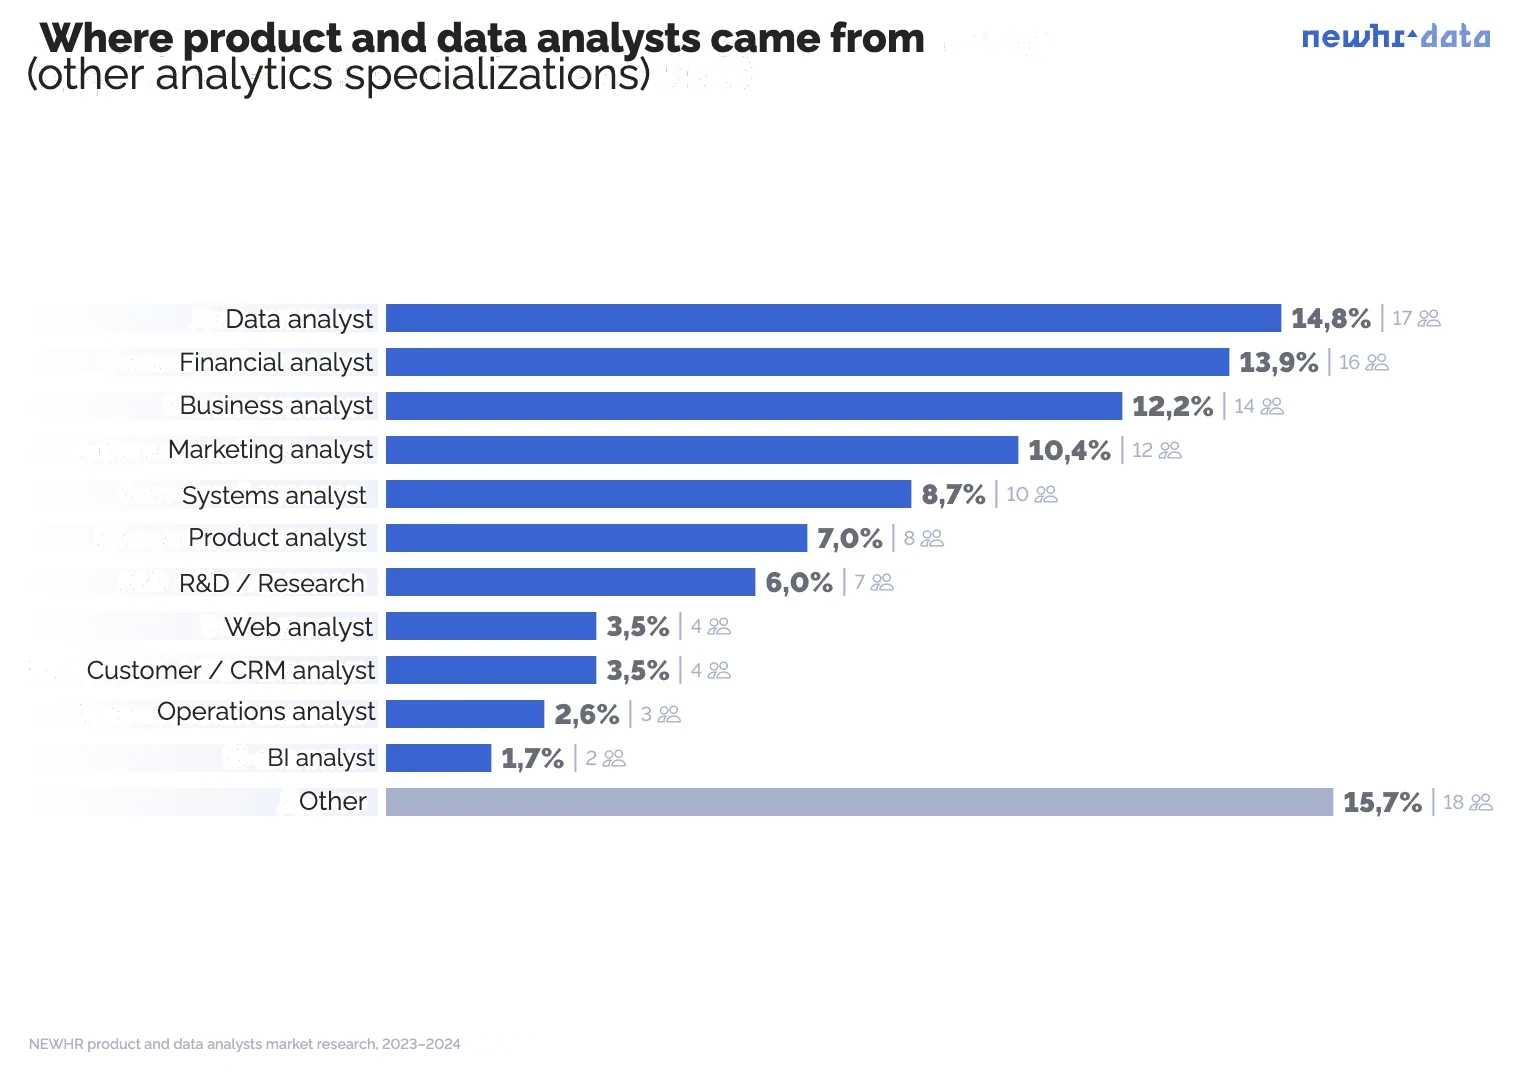
Question: Which analytics specialization did you move from?
Number of respondents: 115
We asked this question only to those who came into product or data analytics from other specializations within analytics.
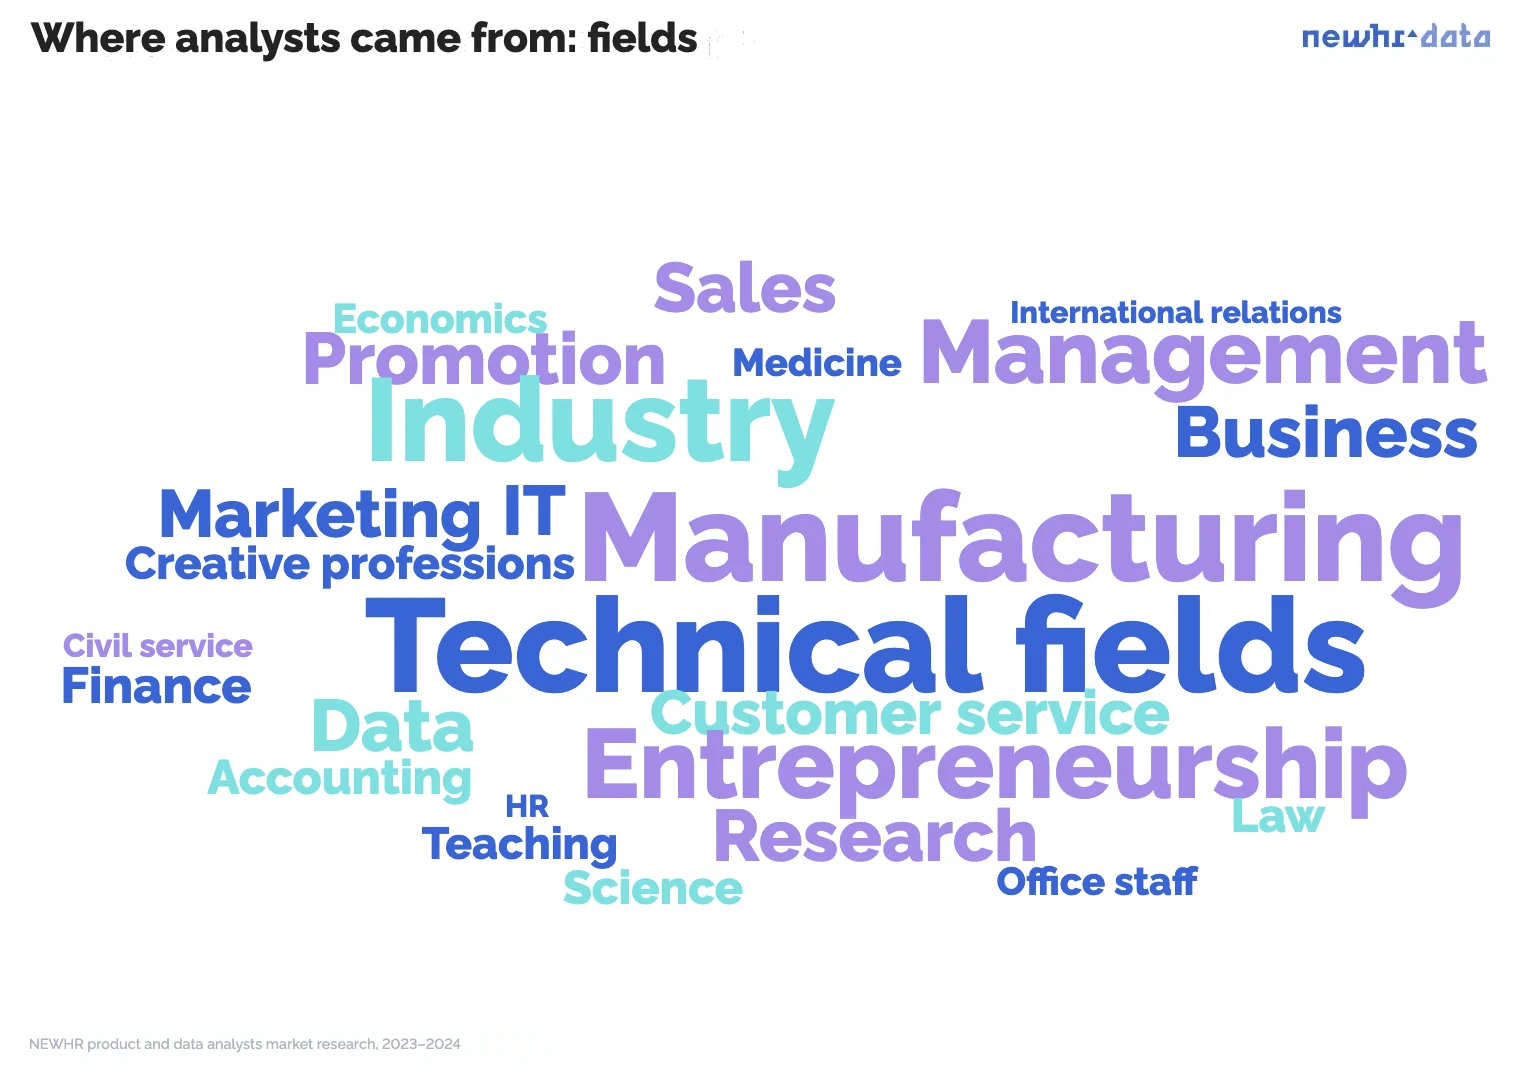
Question: Which profession did you come from?
Number of respondents: 217
- Doctor
- Classical musician
- Personal assistant
- Online poker player
- Translator
- Pilot
- Ship navigator
- Photographer
- Chemist
- Lawyer
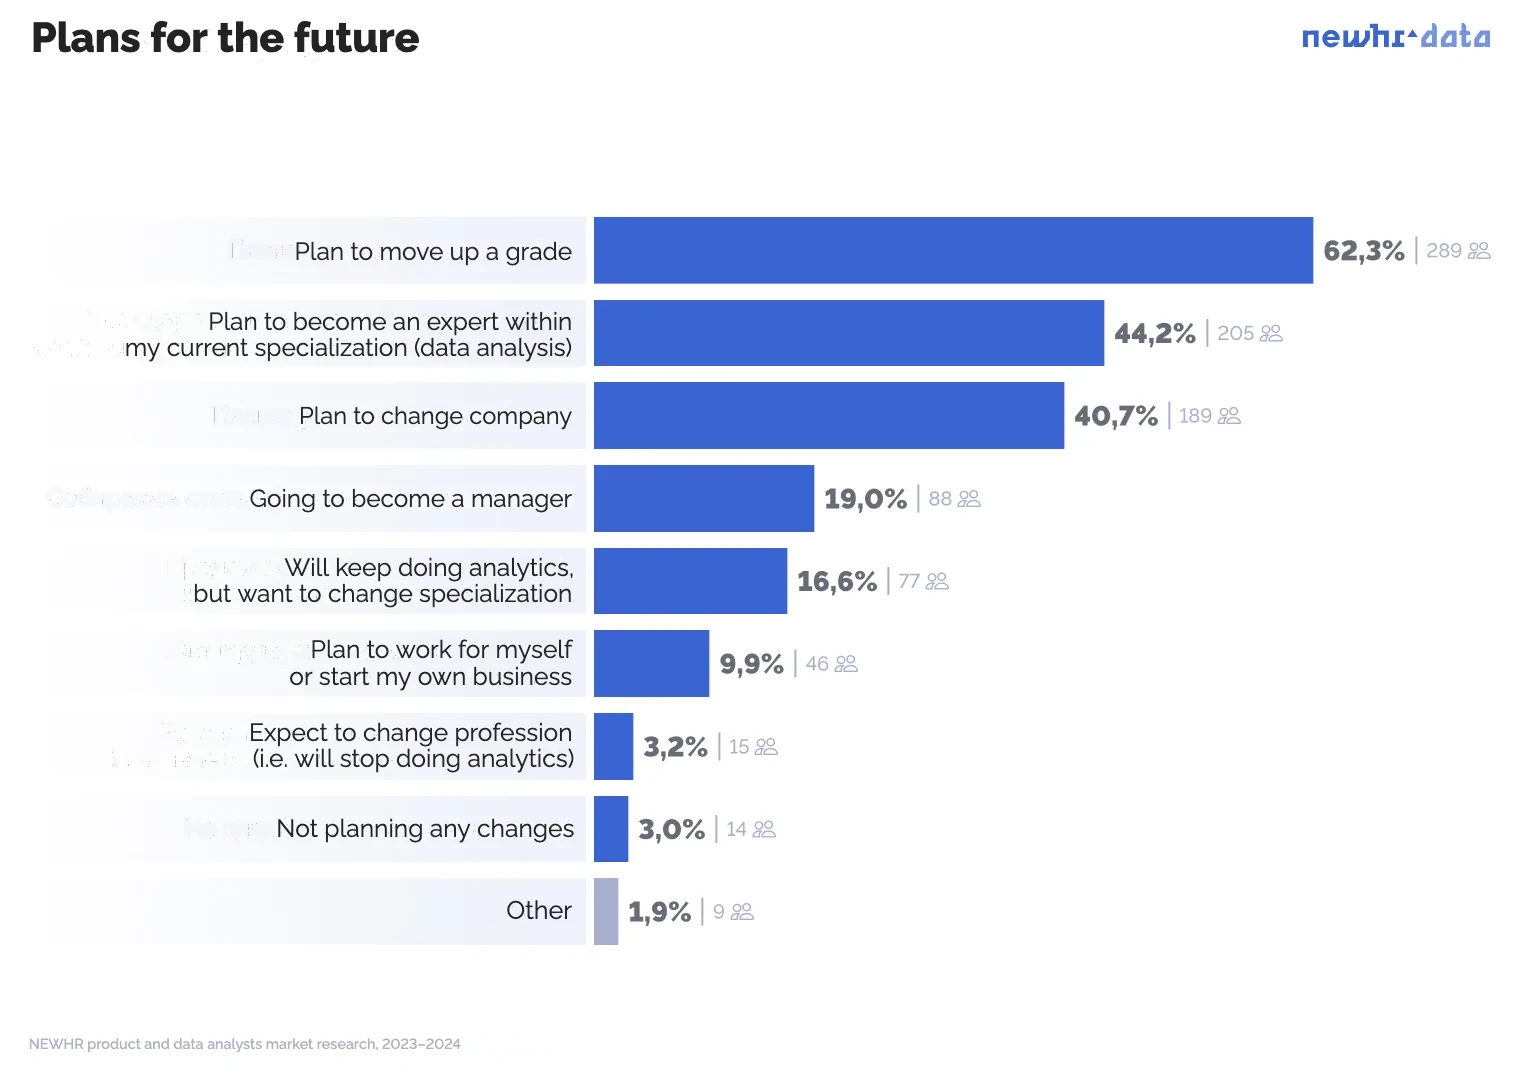
Question: What changes in your career and professional activity are you planning in the next 1.5–2 years?
Number of respondents: 464
Respondents are loyal to their profession: only 3% want to change it. Most want to grow within analytics: move up a grade, become an expert, change employer, etc.
Many plan to become managers or even start their own business. This can be explained by the fact that product and data analysts usually work close to the business.
"We see examples of product analysts becoming company CEOs or starting their own analytics consulting businesses"
Oksana Prutyanova, Lead of Analyst and Data Scientist Search at NEWHR Recruiting
Of the 15 people who want to leave the profession, half plan to become product managers, that is, to go deeper into the business side. There are also those who want to master areas with a more technical bent (data engineering, machine learning).
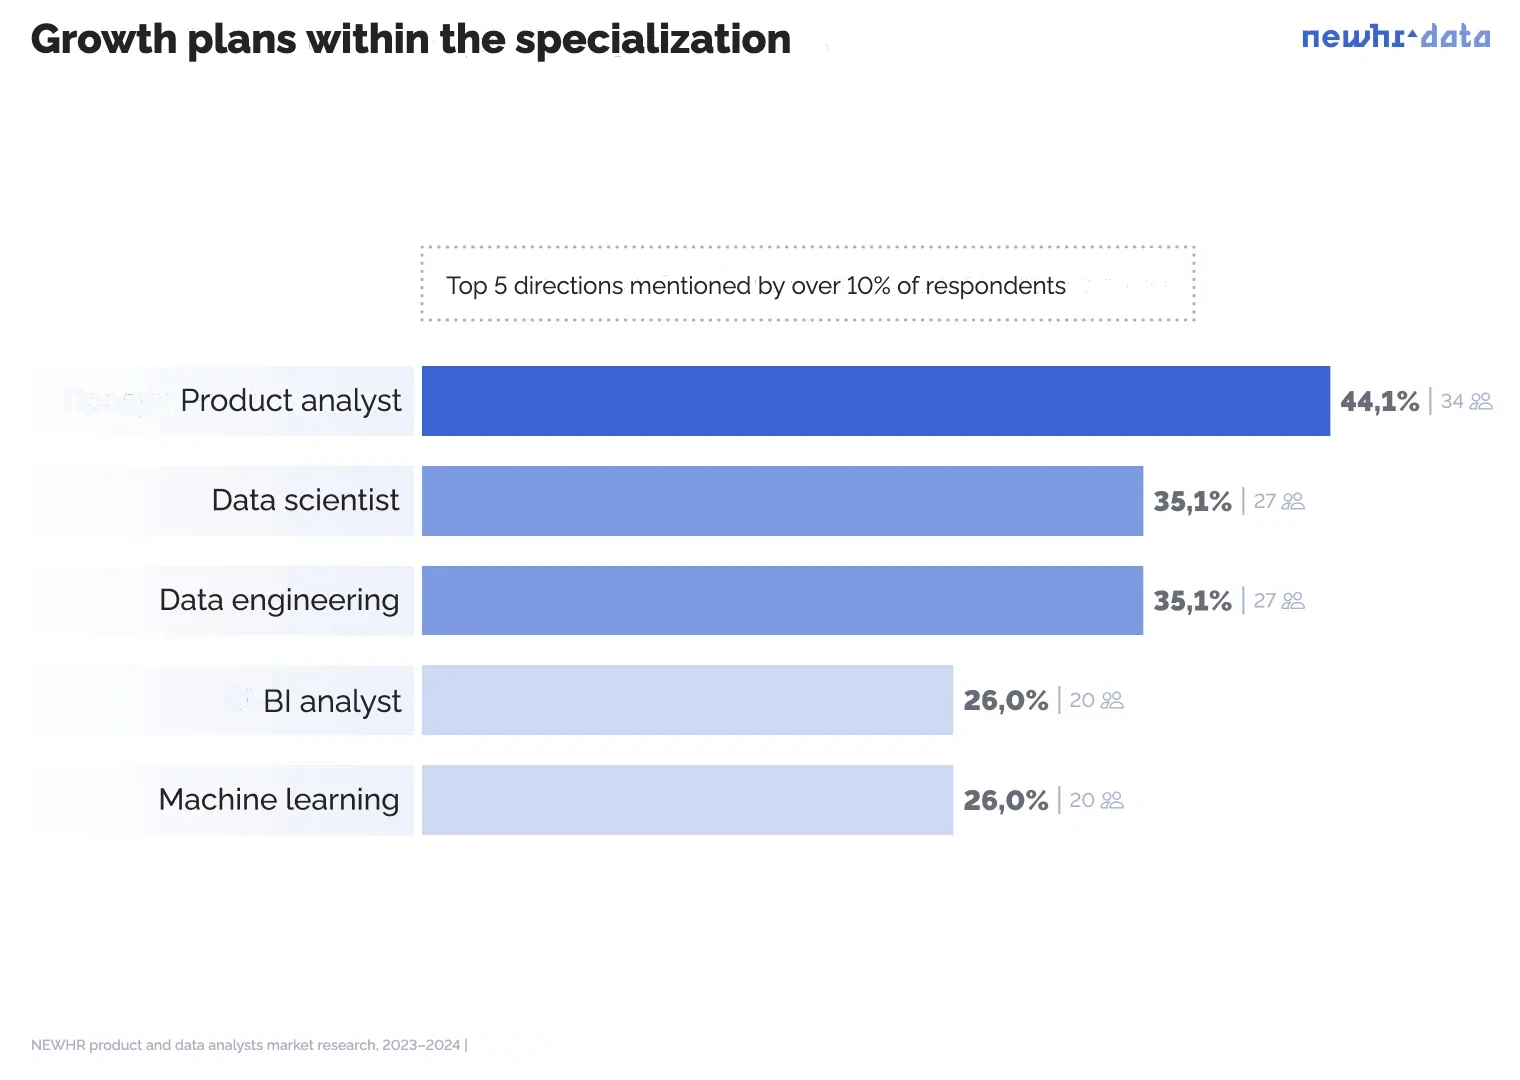
Question: How do you plan to grow within analytics?
Number of respondents: 77
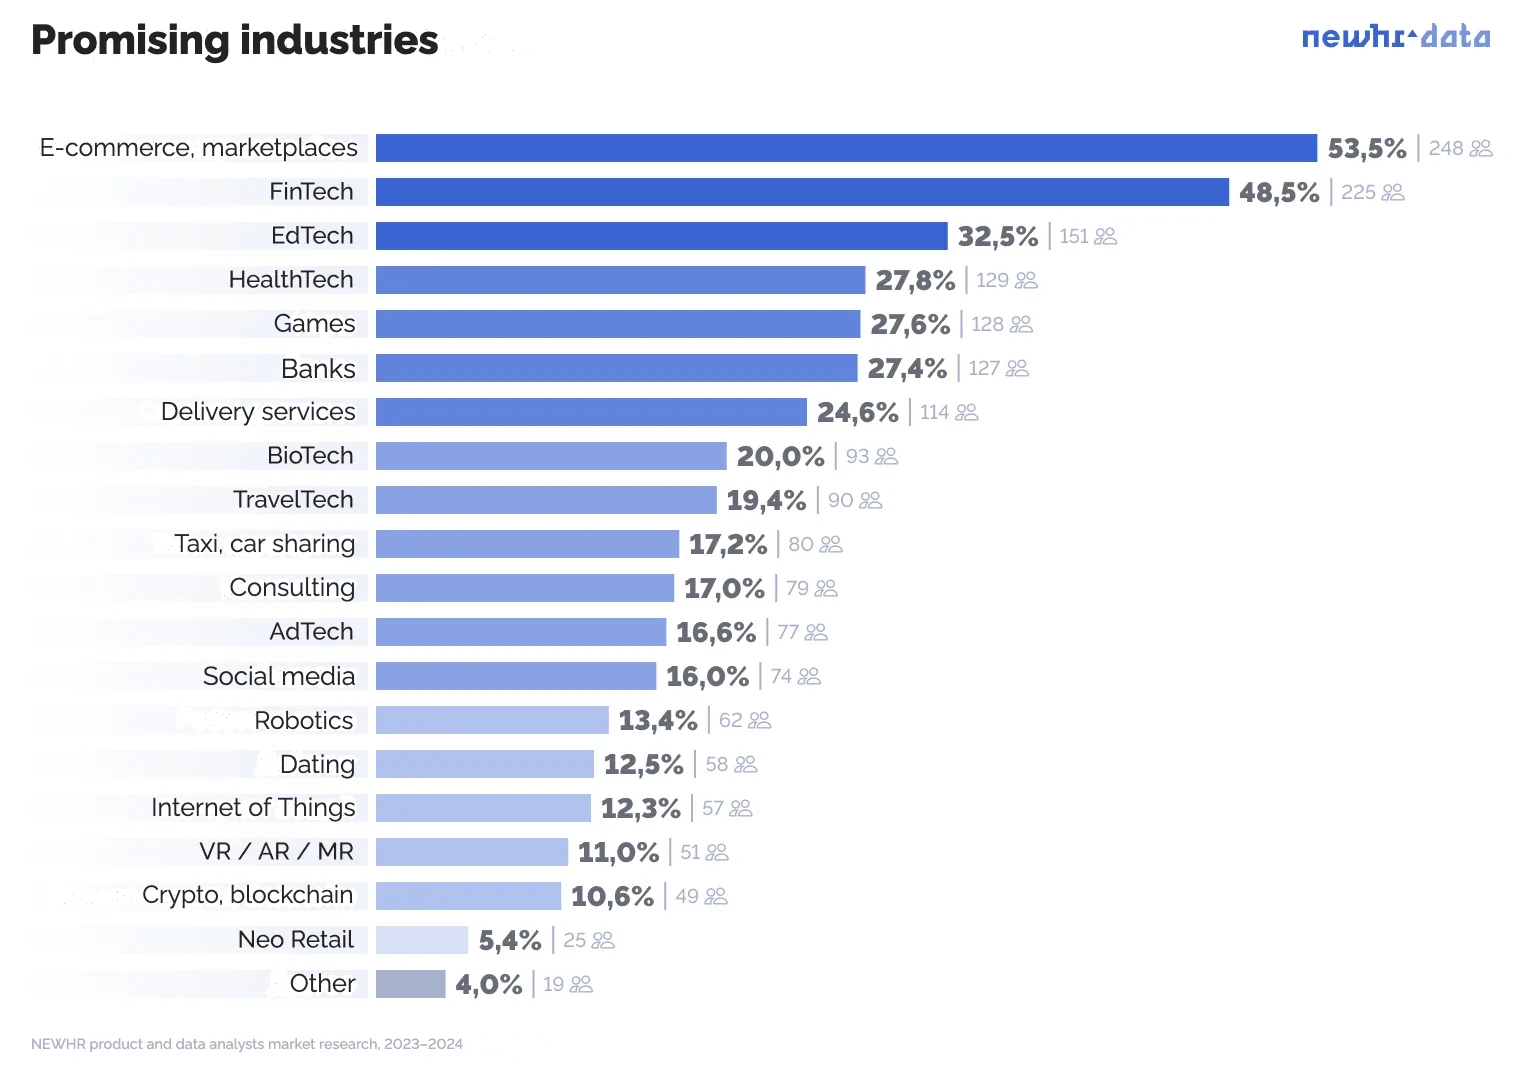
Question: Which industries do you consider the most promising for your professional development?
Number of respondents: 464
Respondents' answers were quite varied. This means analysts are interested in a wide range of industries and feel in demand there.
Interestingly, EdTech came third. In NEWHR Data's previous research on product analysts (2021), third place in the list of industries went to games (32% then vs. 28% now).
"How promising an industry is depends, first, on analysts' personal preferences and interests. Second, employers draw attention to their industries: they run hackathons, open vacancies, publish analytics projects. Employers have tools to raise interest in their company and industry"
Oksana Prutyanova, Lead of Analyst and Data Scientist Search at NEWHR Recruiting
From interview to offer
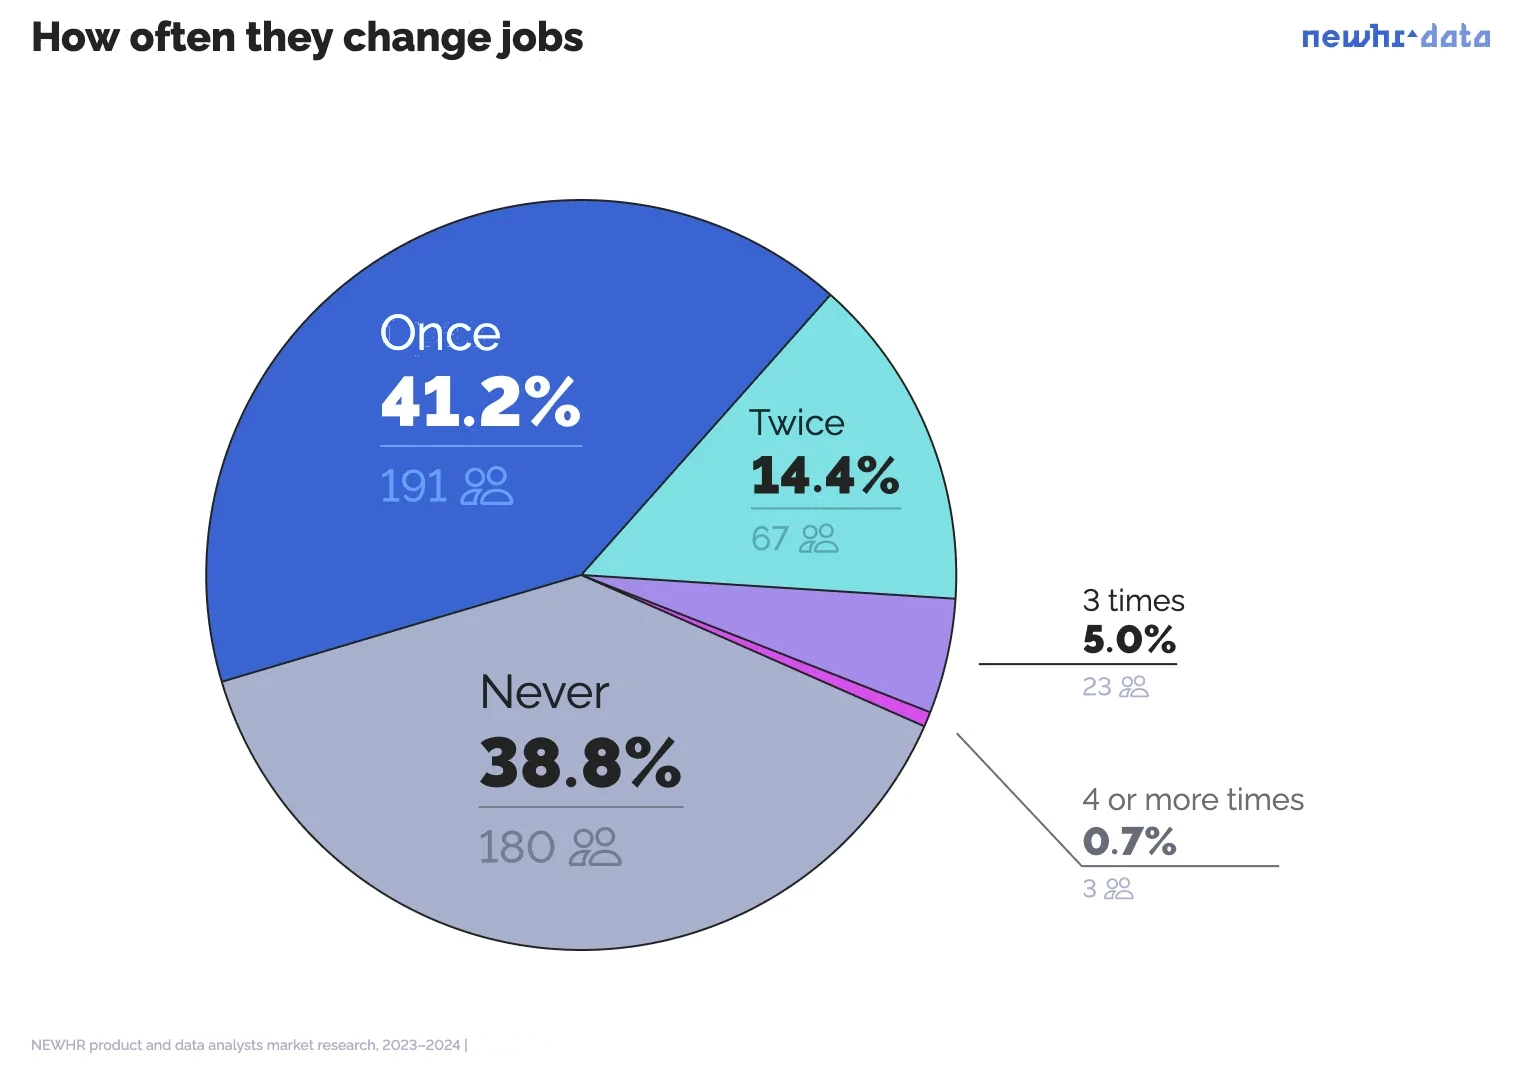
Question: How many times have you changed jobs in the past 2 years?
Number of respondents: 464
61% of respondents changed jobs at least once. Every fifth respondent managed to do so 2 or more times.
In recent years turnover in the profession has dropped. In our previous survey of product analysts, 71% had changed jobs within a period of one to two years.
"At the time of the previous research (in 2021) there were many vacancies on the market. Analysts were hunted more actively, they were in higher demand. People agreed to change jobs more easily and saw fewer risks in it"
Oksana Prutyanova, Lead of Analyst and Data Scientist Search at NEWHR Recruiting
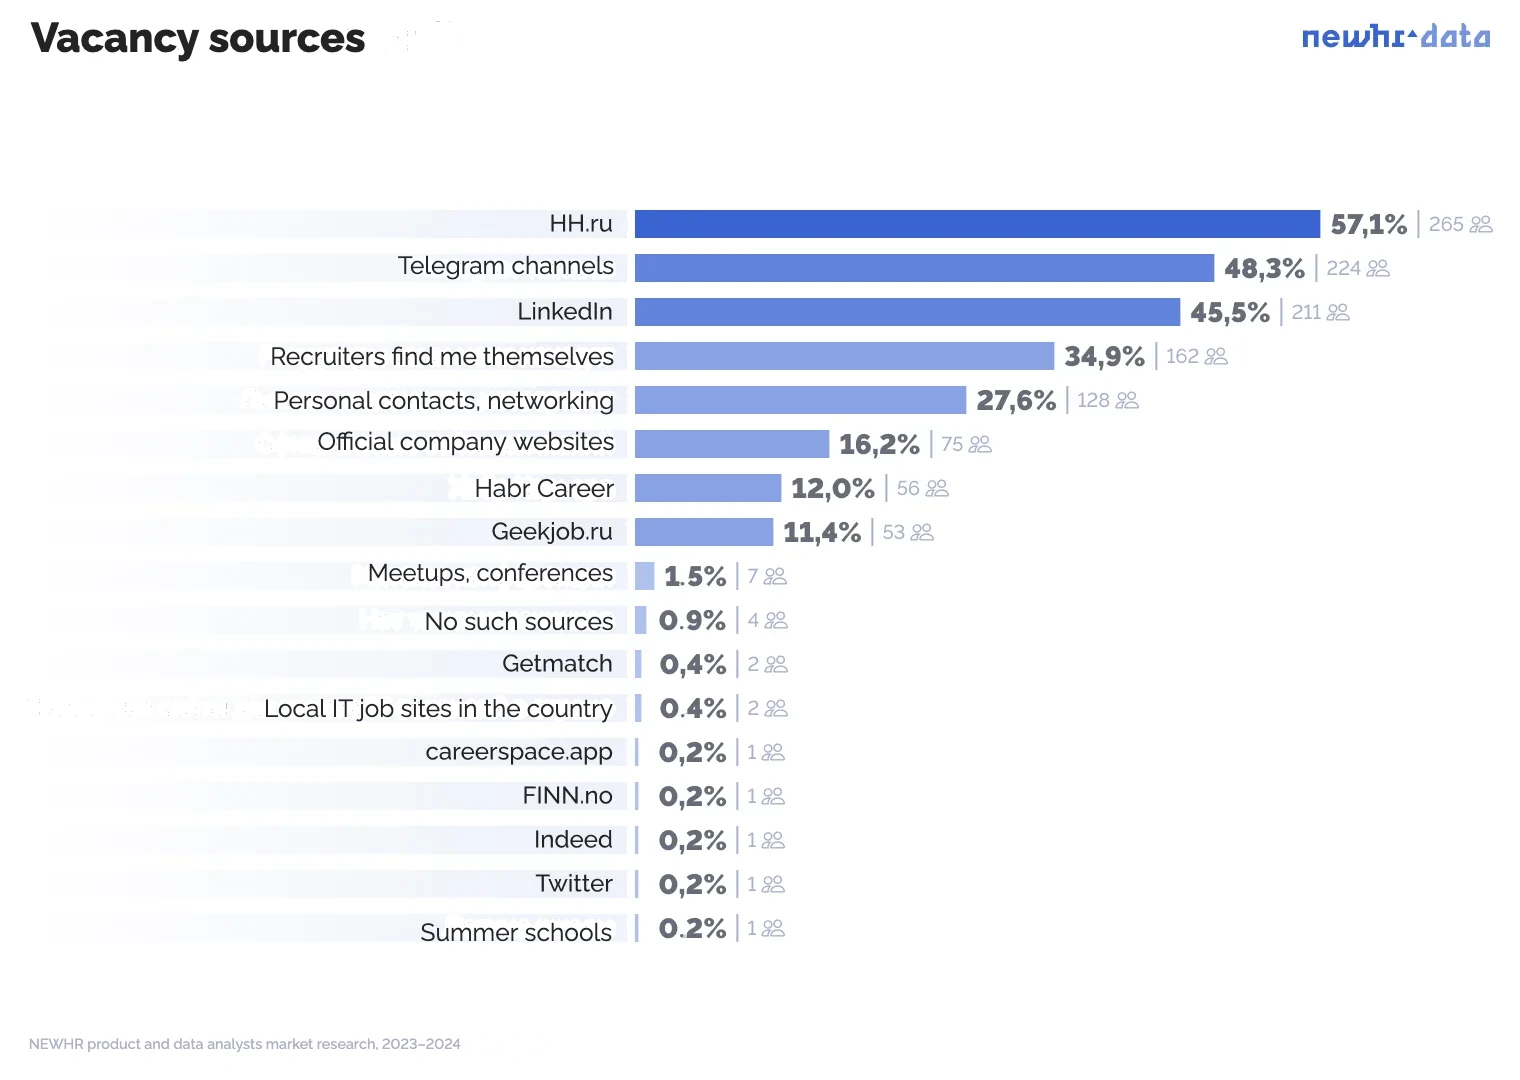
Question: Where do you find the most interesting analytics vacancies?
Number of respondents: 464
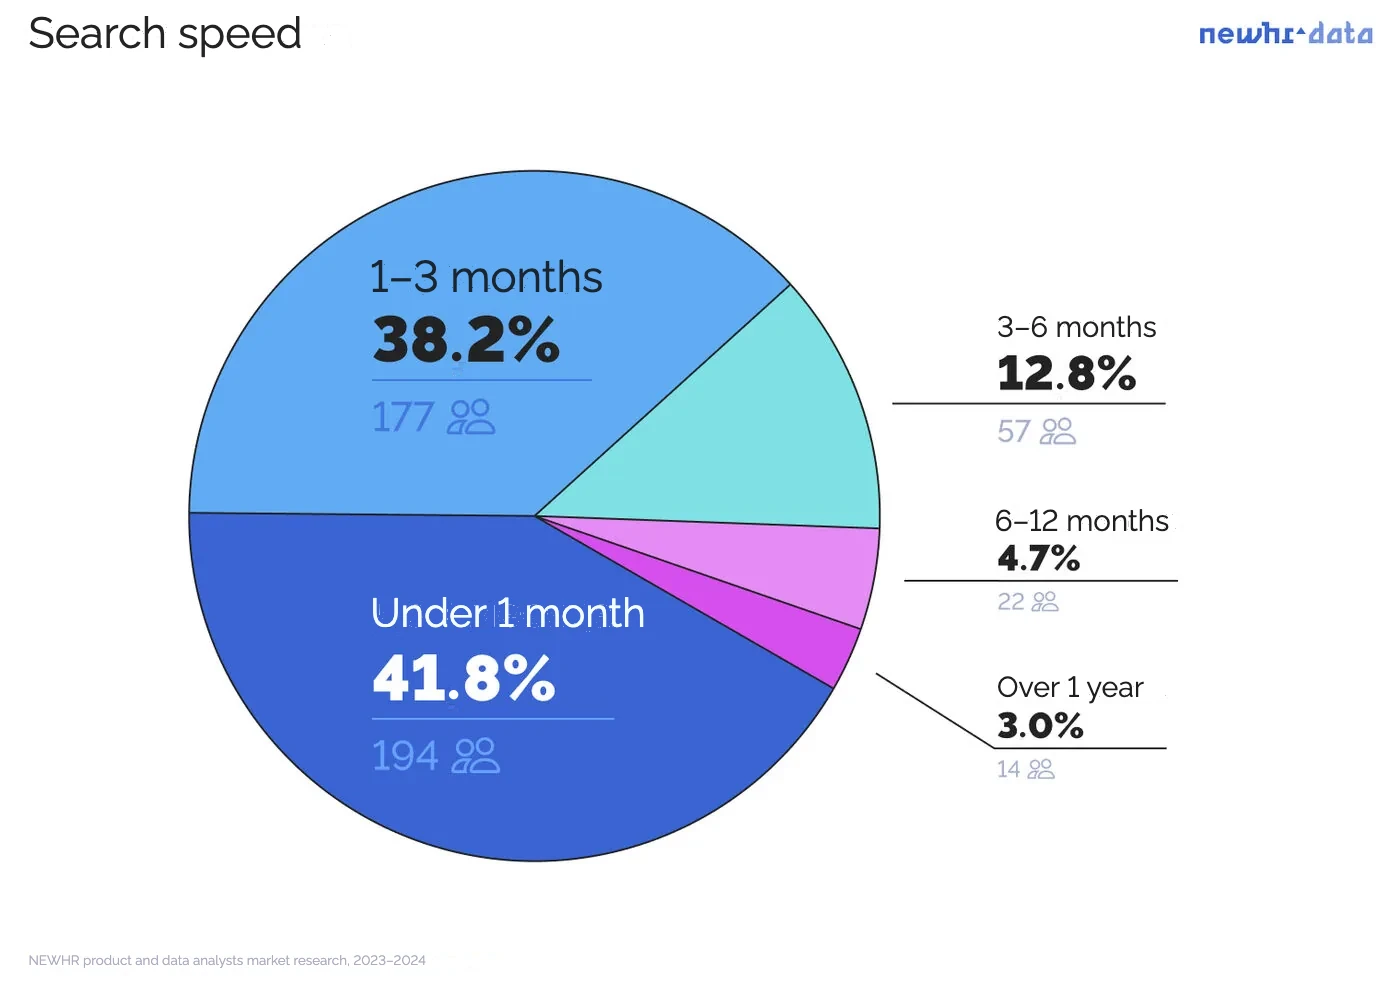
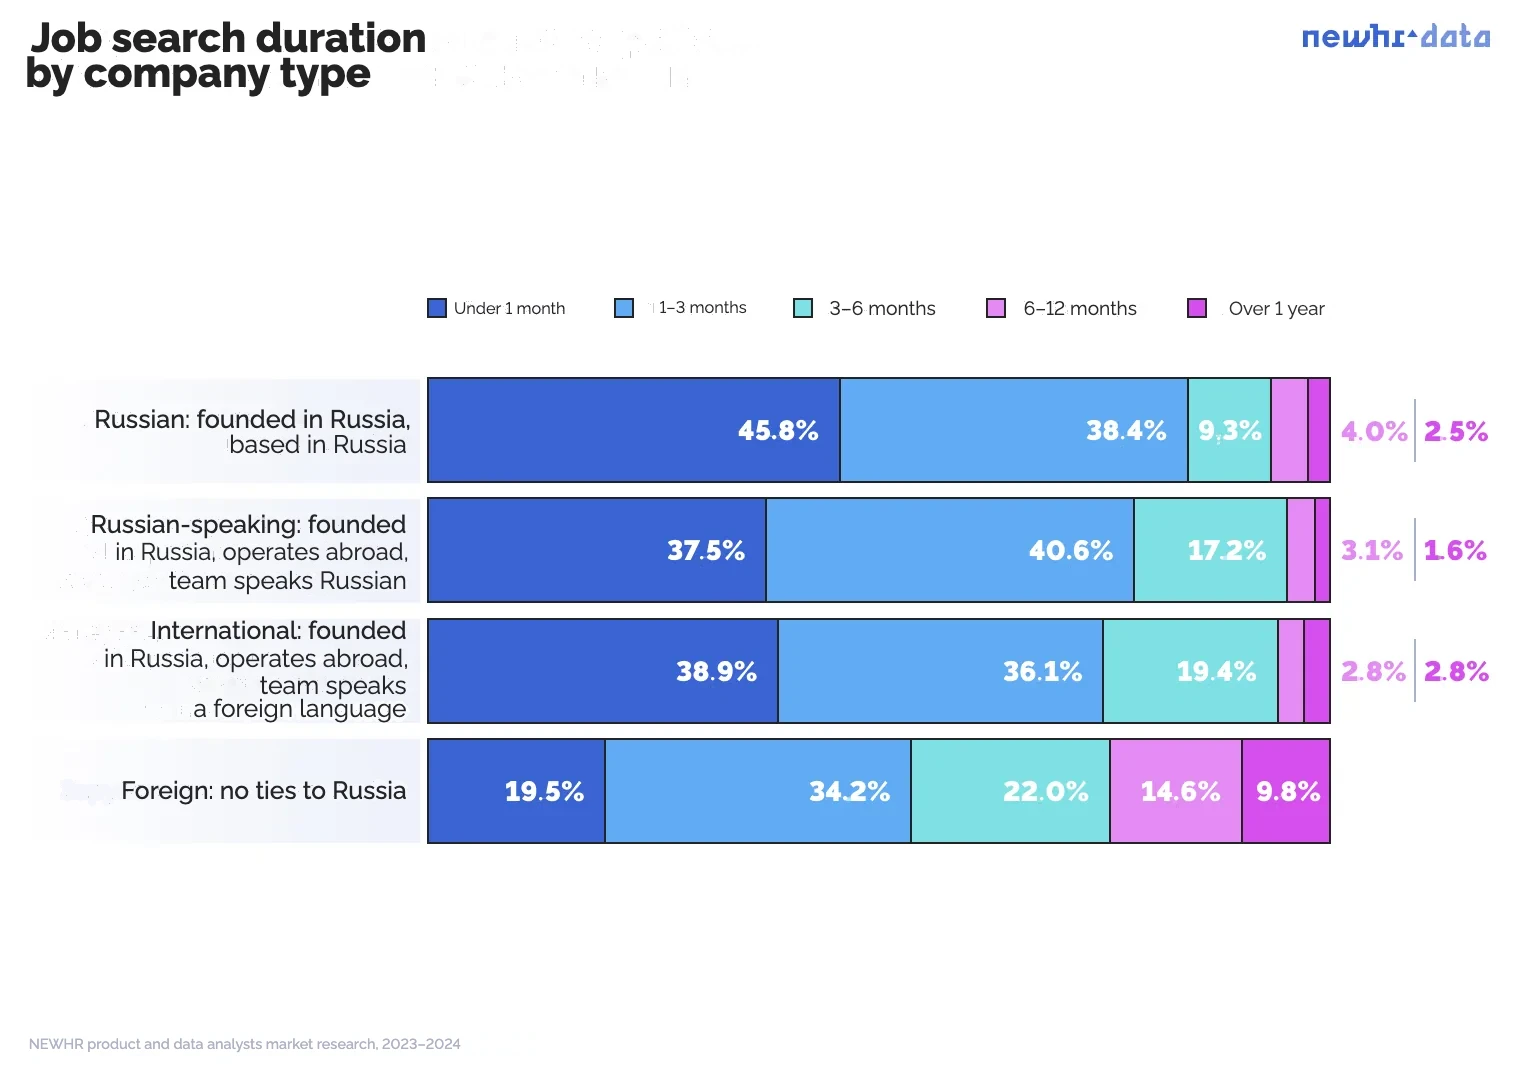
Question: How long did your last job search take?
Number of respondents: 464
Grade does not affect how fast people find a job, our data showed. But the time frame depends heavily on the location of the company the analyst is joining (see the chart).
Question: Name the companies where you had interviews
Respondents who went to interviews: 284 Answered: 116
- Top 15 companies by number of interviews
- Yandex — 31.9% | 37 people
- Tinkoff — 21.6% | 25 people
- Avito — 18.1% | 21 people
- Sber and its projects (Sberbank, SberMarket, SberZdorovye, etc.) — 17.2% | 20 people
- Ozon — 16.4% | 19 people
- VK — 12.9% | 15 people
- Wildberries — 9.5% | 11 people
- MTS — 7.8% | 9 people
- Samokat — 7.8% | 9 people
- Lamoda — 6.9% | 8 people
- X5 — 5.2% | 6 people
- Alfa-Bank — 5.2% | 6 people
- Lenta — 5.2% | 6 people
- Raiffeisenbank — 5.2% | 6 people
- Tochka Bank — 5.2% | 6 people
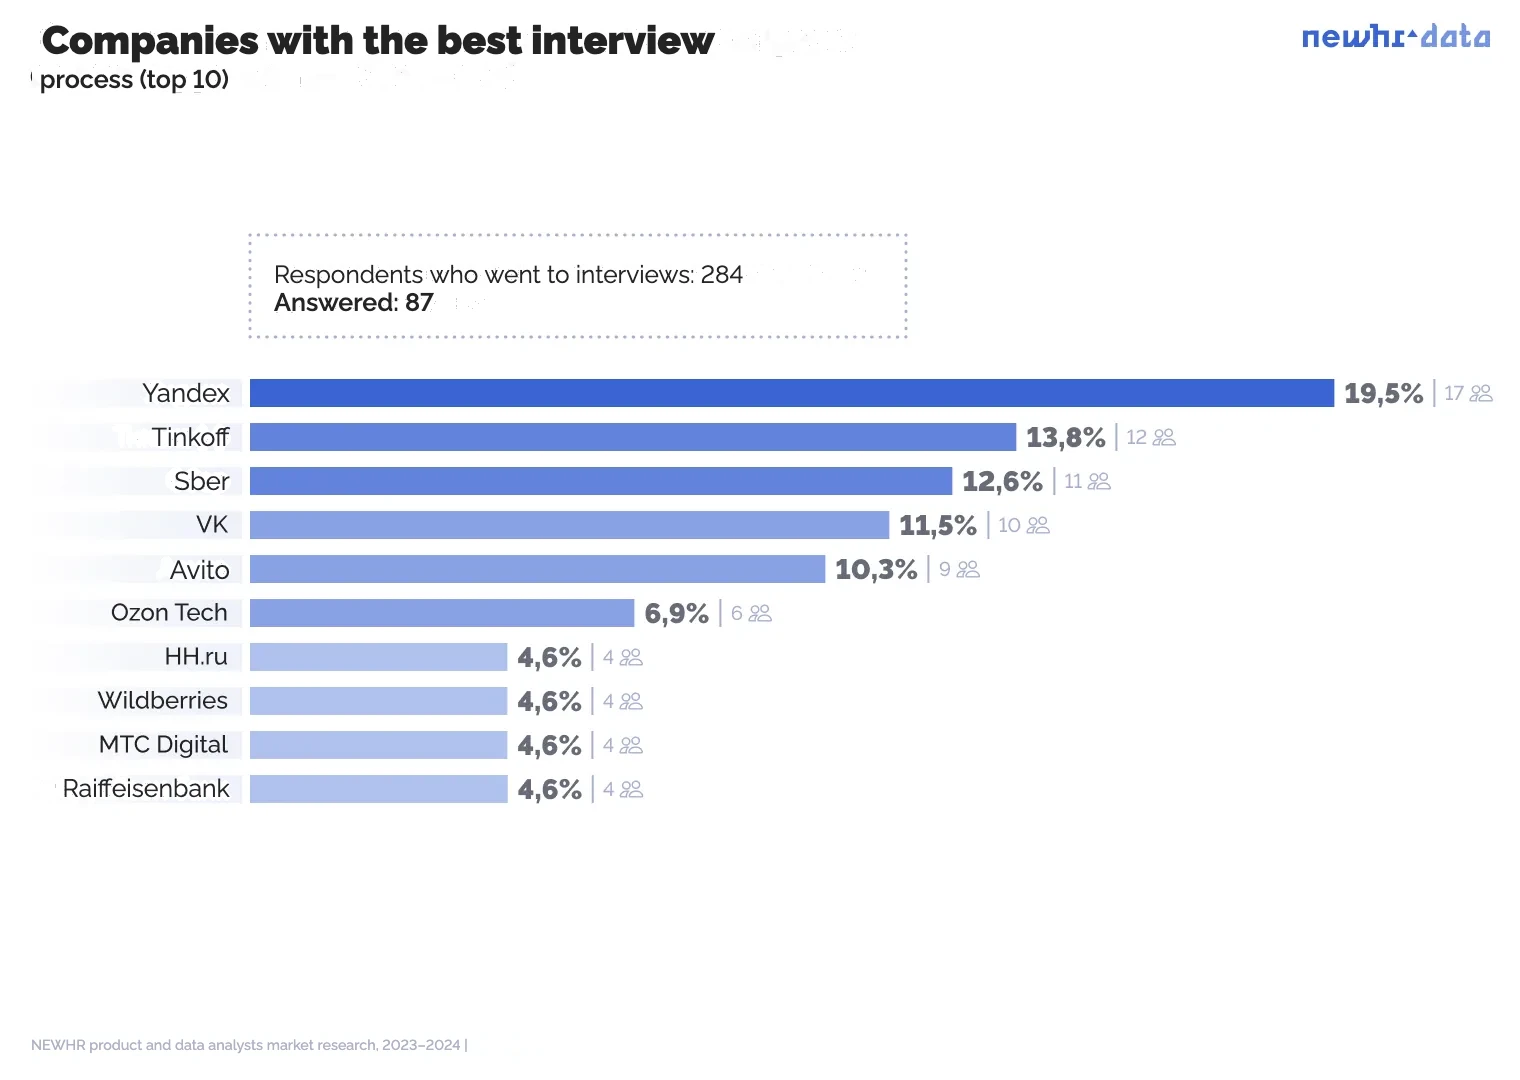
Question: At which companies did you like the interview process?
Respondents who went to interviews: 284 Answered: 87
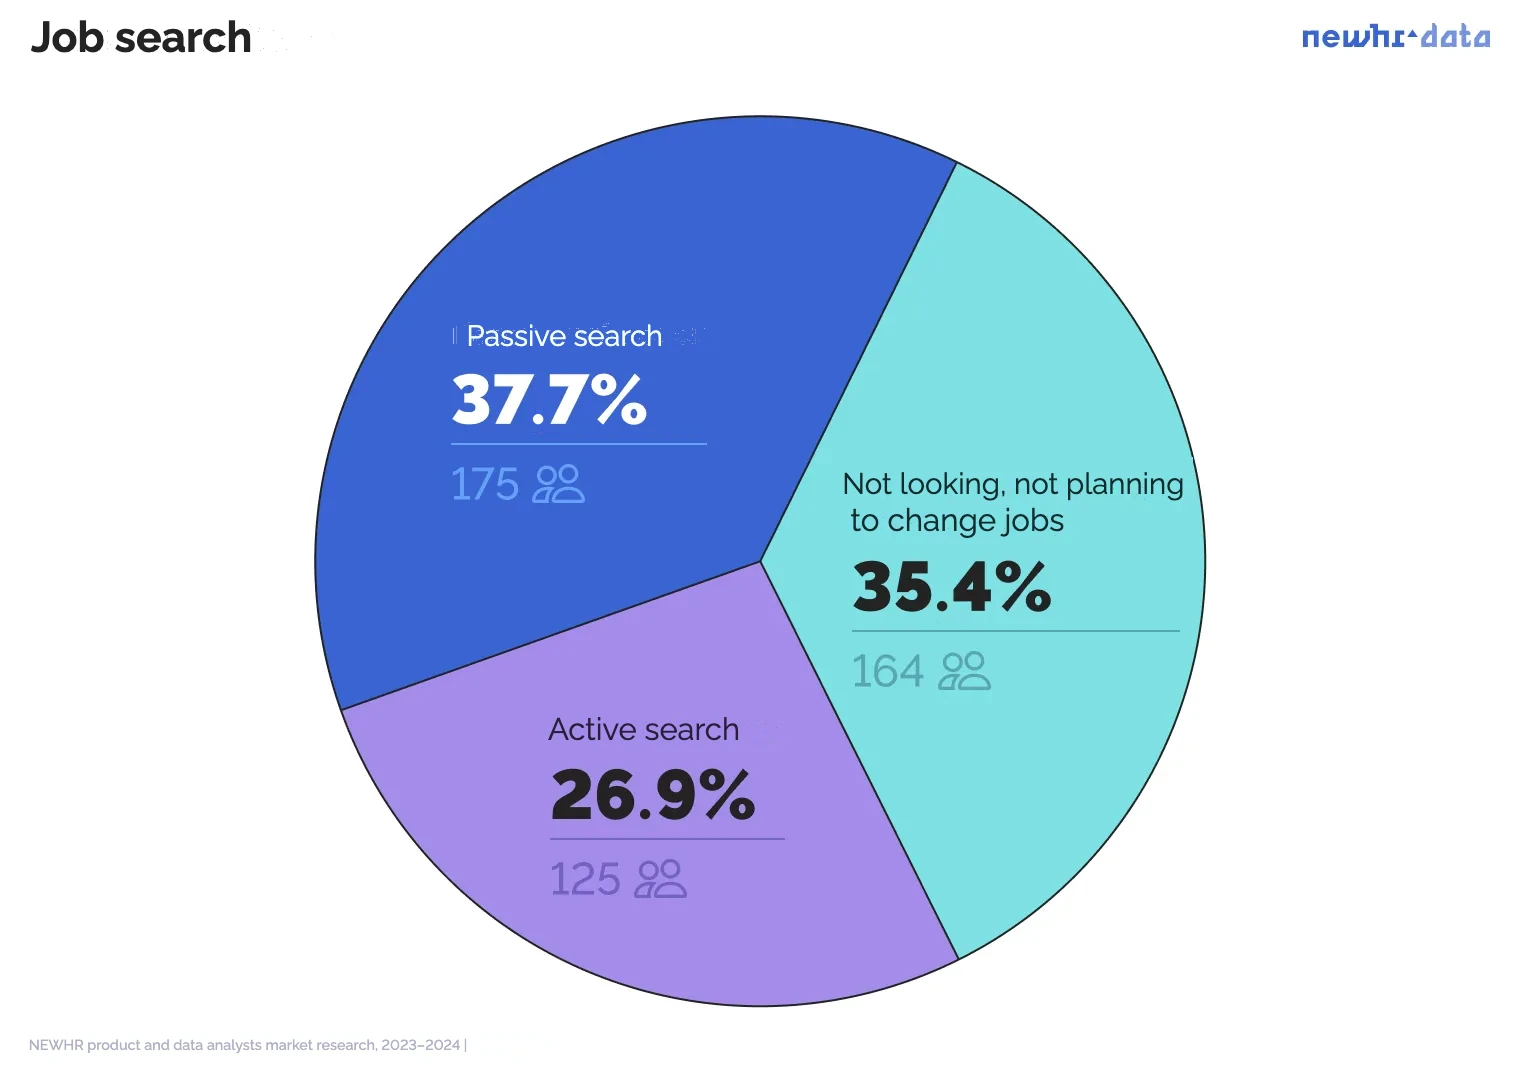
Question: Are you considering changing jobs right now?
Number of respondents: 464
- 75% of those actively looking for a job
- 60% of those in "passive search"
- 52% of those who are "not looking and not planning to change jobs" in the next six months
"In 2021 candidates felt that the market would always be fine and there was no need to make extraordinary efforts. Since then the influence of external factors has grown.
Today analysts take the initiative more often to offset external risks: they build up soft skills, English and other competencies, and expand their professional network. Candidates are more willing to talk and engage with employers. This doesn't mean they are all ready to accept an offer, but you can at least start a conversation with them"
Oksana Prutyanova, Lead of Analyst and Data Scientist Search at NEWHR Recruiting
Question: What keeps you at your current job?
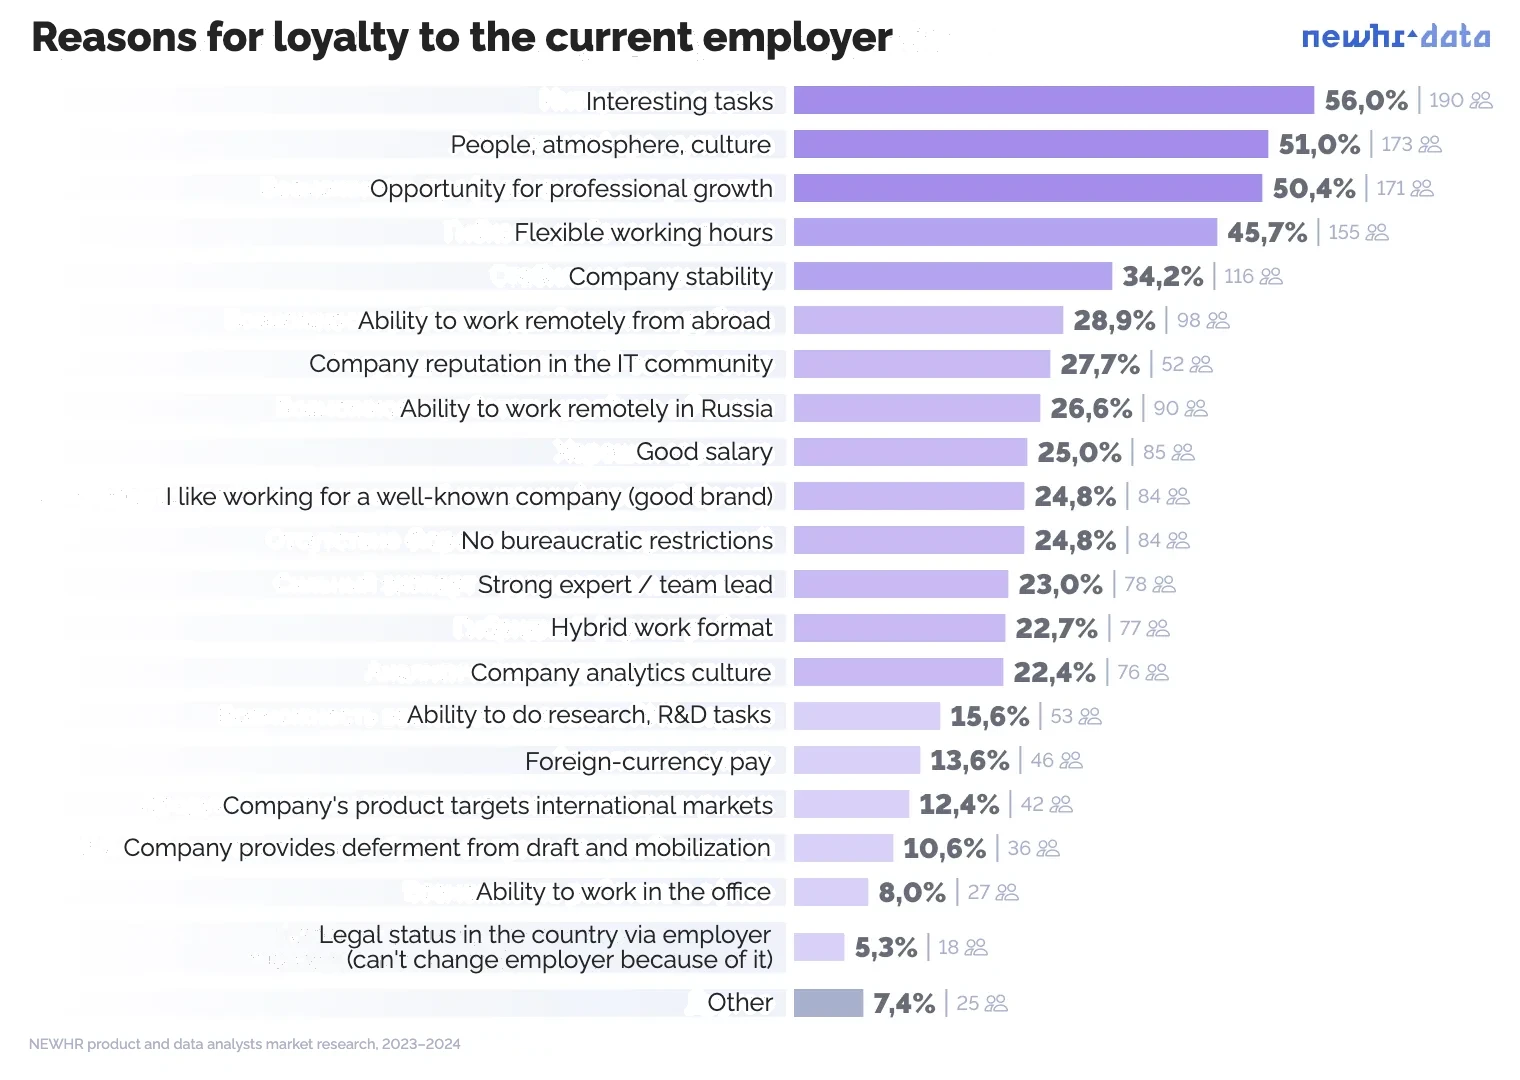
Number of respondents: 339
What keeps analysts at their current job is the opportunity to grow professionally, the tasks, a familiar team and a comfortable work format.
A good salary is an important factor, but it is mentioned half as often (25%). Meanwhile, in our 2021 research on product analysts, salary came second (30%).
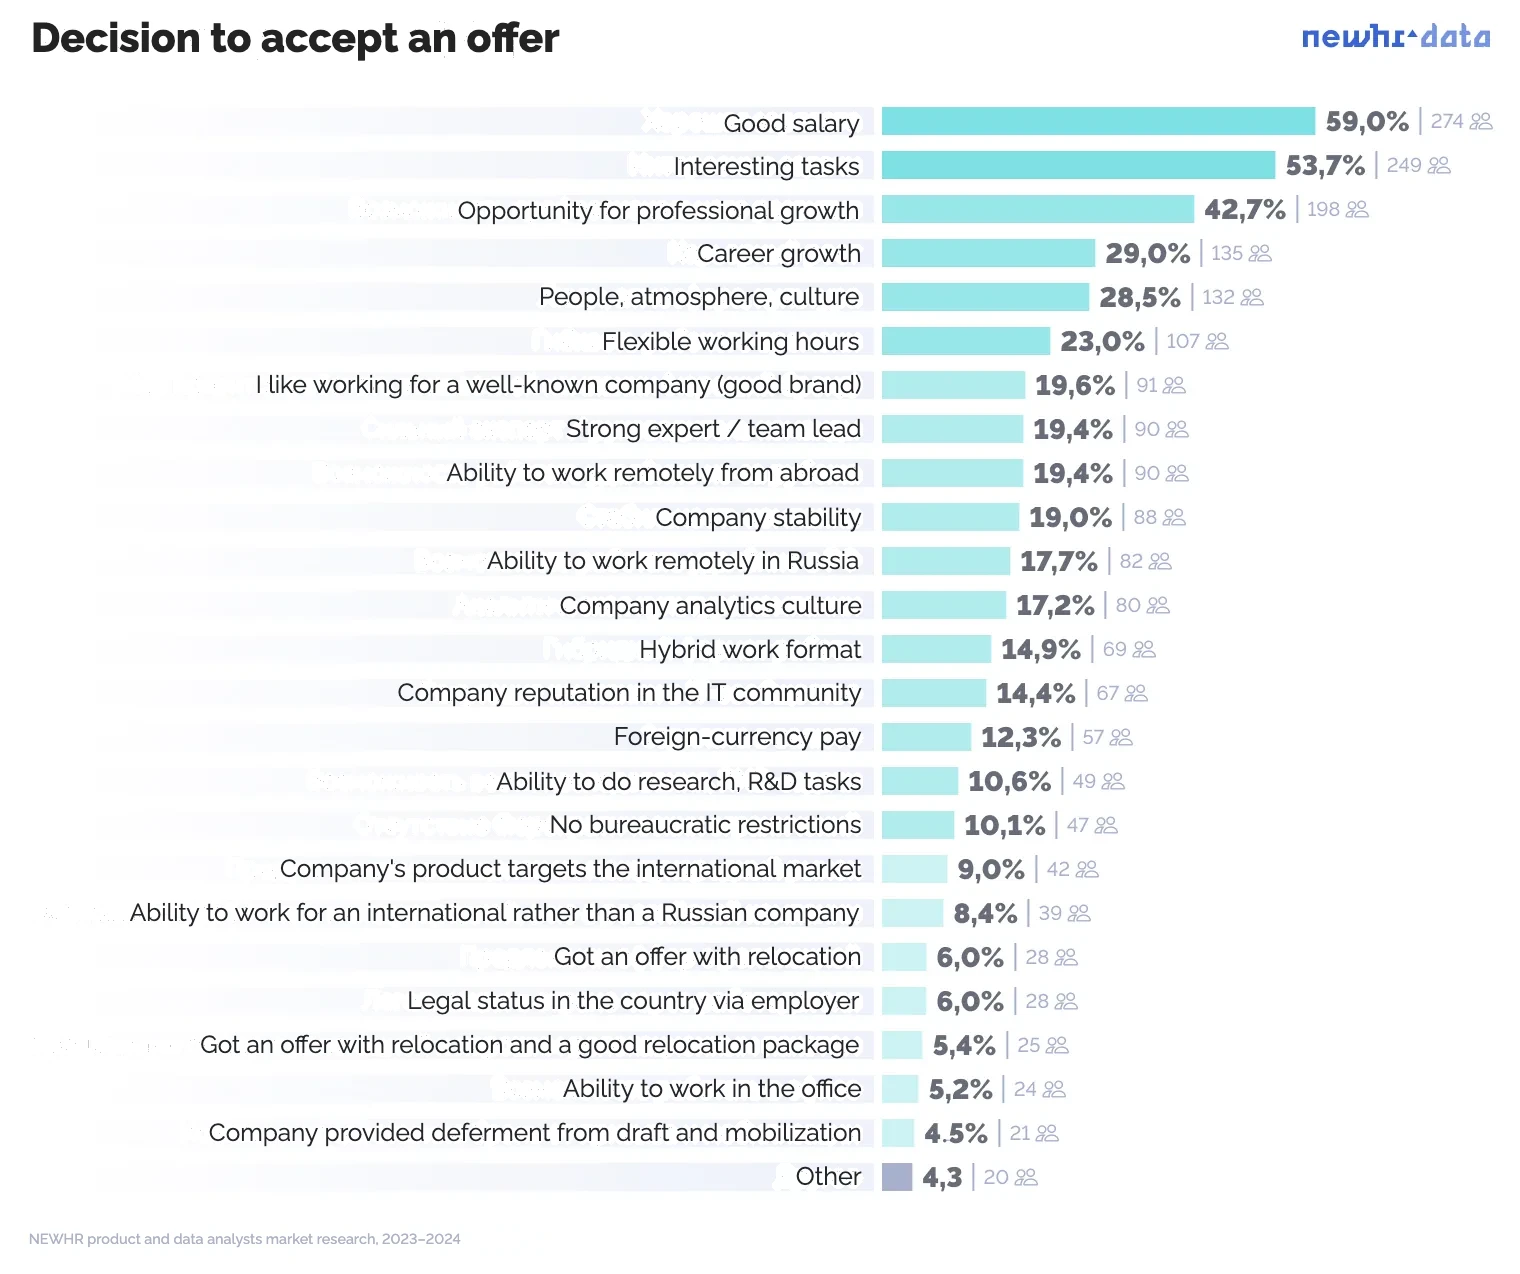
Question: What was the key argument for accepting an offer during your last job search?
*Number of respondents: 464
Multiple choice*
When people decide whether to accept a particular offer, salary comes first. This is because by the time they are choosing an offer, candidates have usually already filtered by other important criteria: company location, work format, salary currency, tasks and so on.
Also, more than 50% of respondents accept an offer because of interesting tasks. This means analysts are strongly motivated by professional growth — this factor matters to them as much as money.
Favourite companies
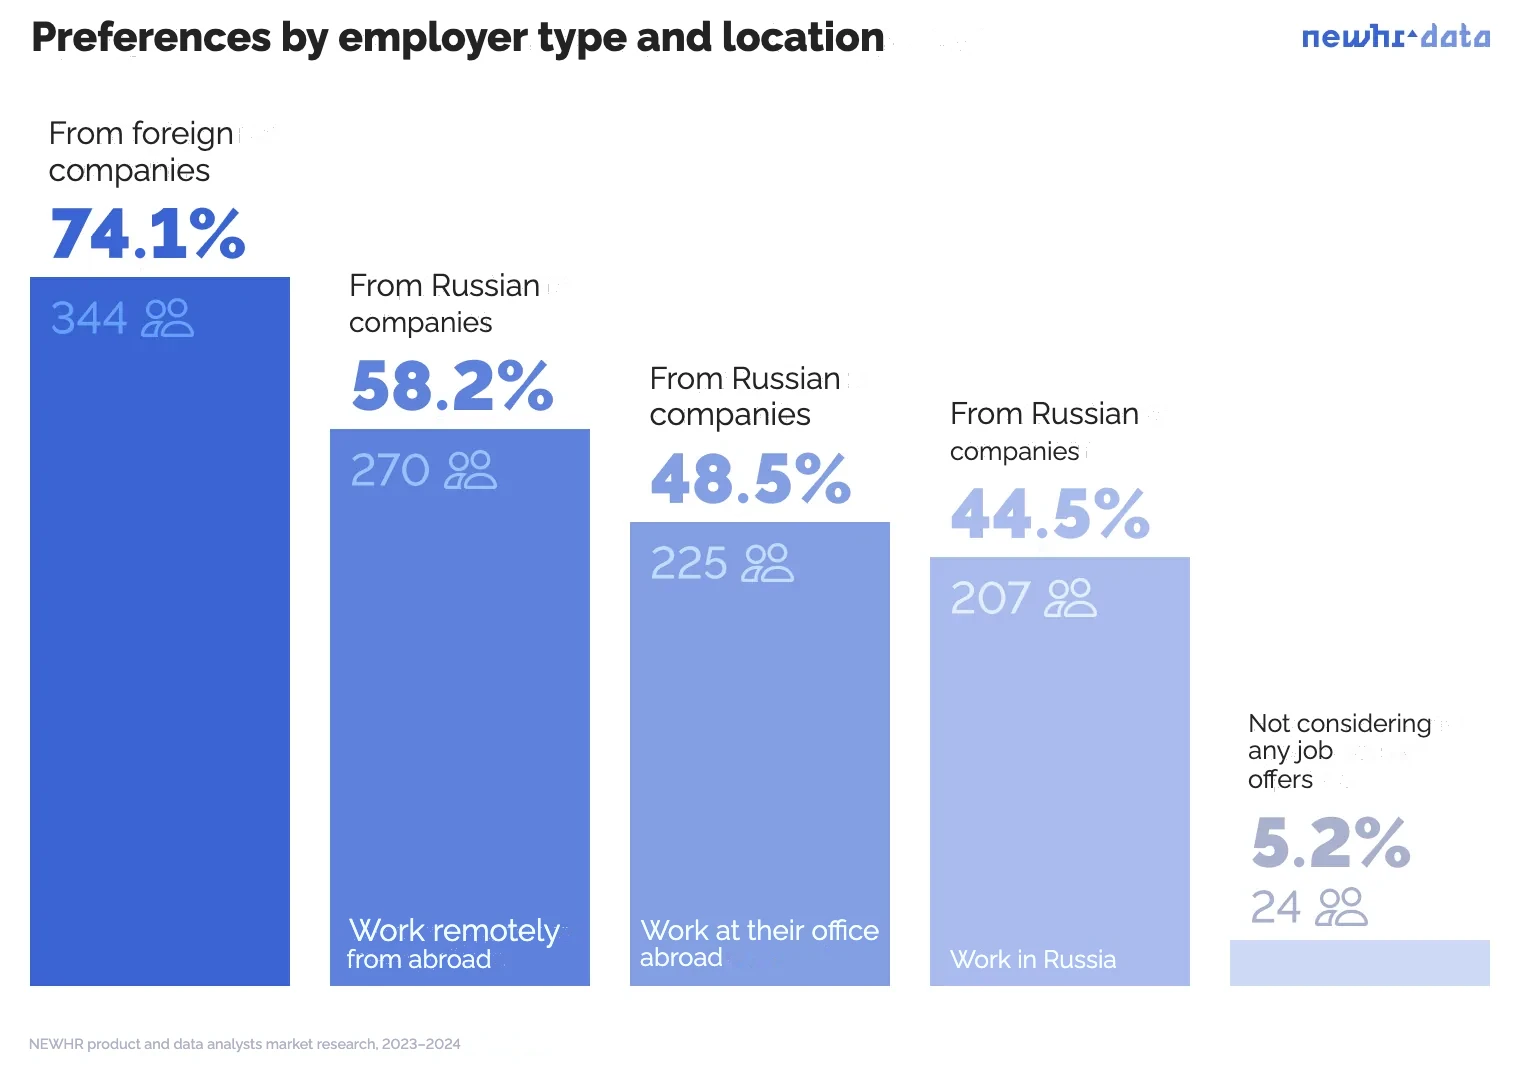
Question: Which companies are you prepared to consider offers from in principle?
Number of respondents: 464
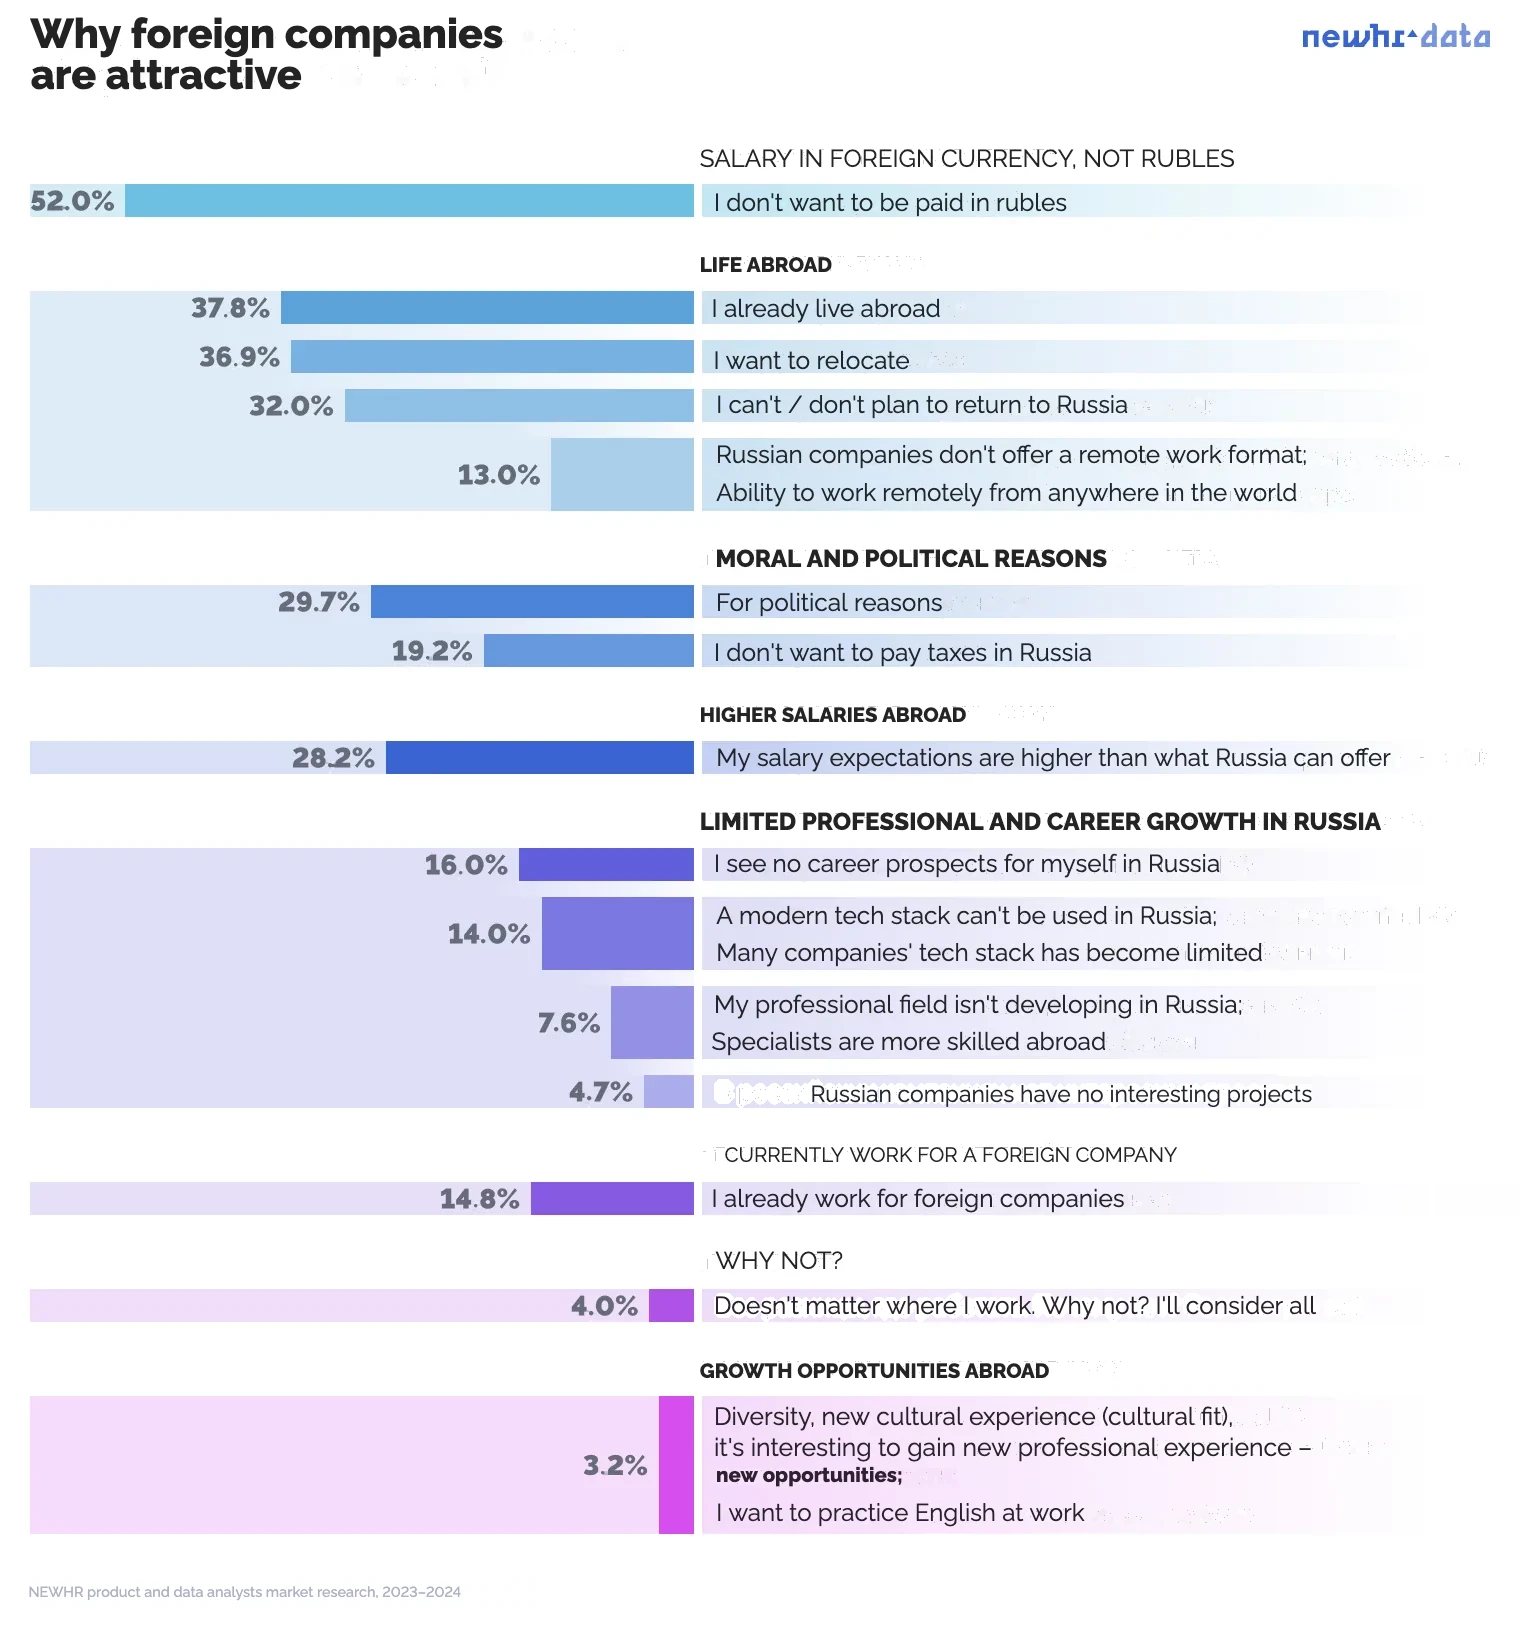
Question: Tell us why you choose foreign companies
Number of respondents: 344
Respondents often gave reasons phrased as negatives: "I don't want to be paid in rubles", "I'm not planning to return to Russia" and so on. Many analysts are not so much eager to work abroad as keen to avoid factors associated with the Russian market.
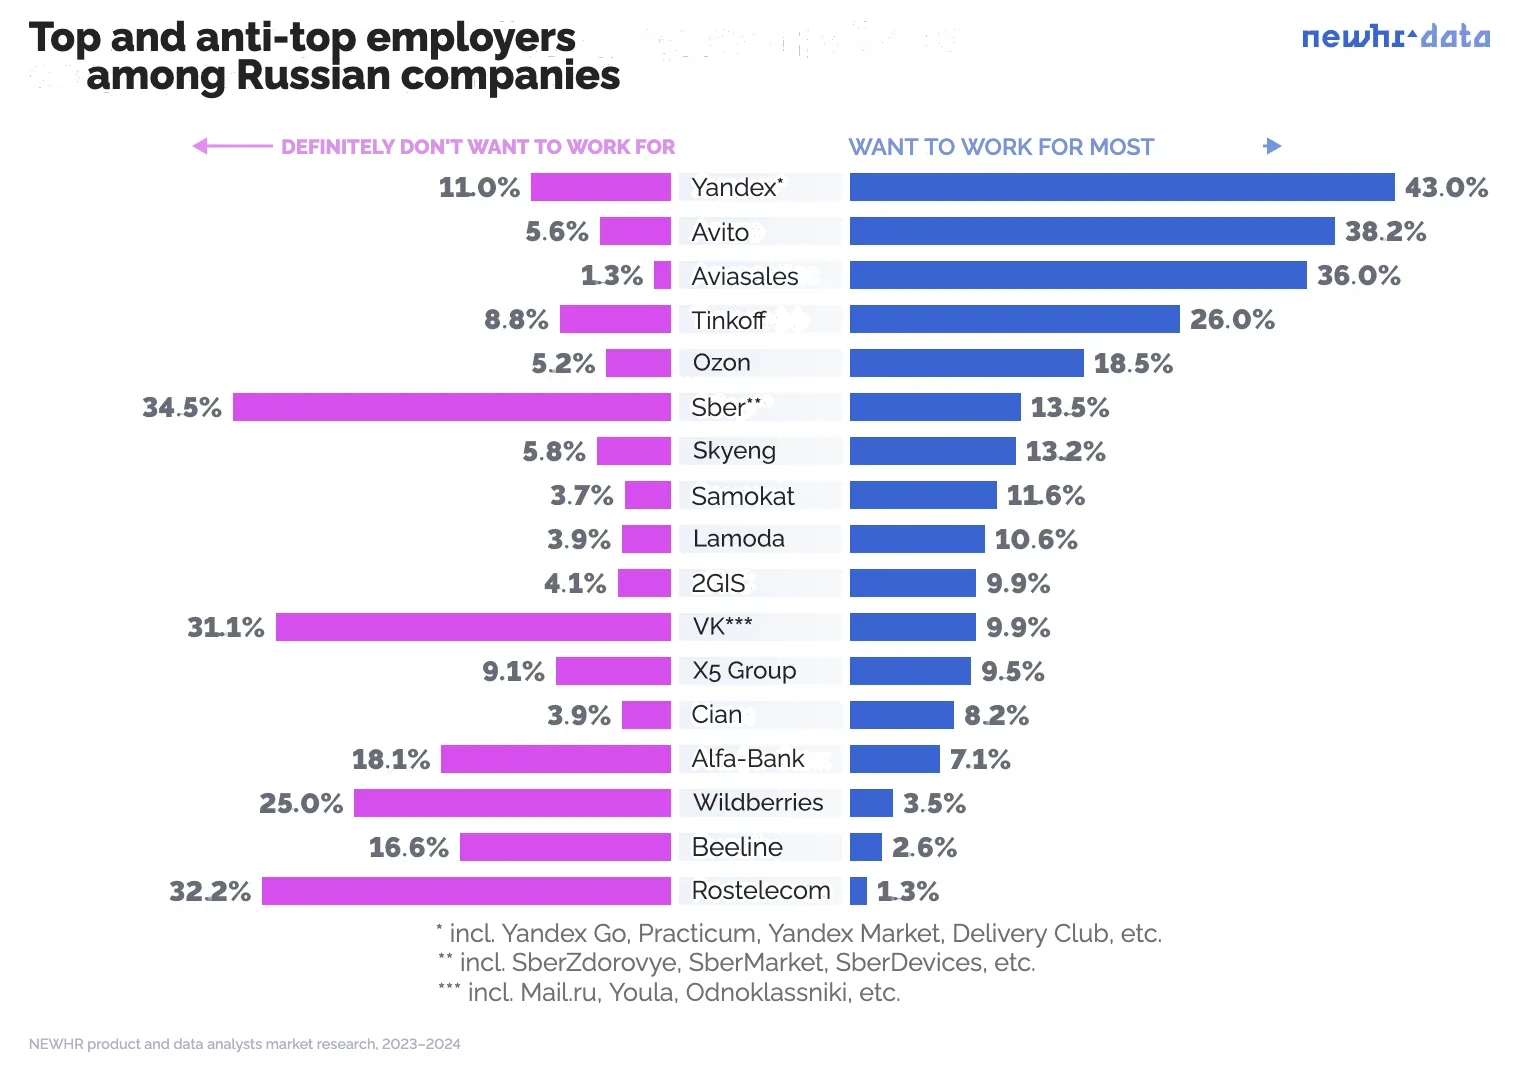
Question: Choose 3 companies on the Russian market where you would happily consider a job
Number of respondents: 464
Question: Name 3 companies where you would definitely not consider a job
Number of respondents: 464
If negative attitudes toward a company outweigh positive ones, this does not mean candidates will ignore that company's vacancies. However, it may matter when a candidate is choosing a particular offer.
Analytics culture
Question: What does a good analytics culture in a company mean to you?
Number of respondents: 464
- 84.7% | 393 answers
- Analysts' work directly affects the product and the business
- 69.4% | 322 answers
- Data availability and quality
- 56.7% | 263 answers
- A professional analytics community inside the company
- 45.0% | 209 answers
- A high level of automation
- 41.2% | 191 answers
The ability to drive key projects with business impact independently
36.4% | 169 answers
The company's analysts share their expertise in the public professional community
36.2% | 168 answers
A clear and transparent system of professional and career growth in the company
- 1.3% | 6 answers
- Other
Good analytics culture in respondents' own words
Spelling and punctuation preserved in the original
"By analytics culture I mean that most departments are focused on efficiency, measure their results through analysts; generate ideas and bring them to life; run tests"
Good analytics culture in respondents' own words
Spelling and punctuation preserved in the original
"Business and management are guided by data when making decisions: Business and product managers understand the importance of analytics and rely on numbers when making decisions, good communication and collaboration between business, product and analysts"
Good analytics culture in respondents' own words
Spelling and punctuation preserved in the original
"The main thing - Management is guided in making managerial decisions based on data / metrics / dashboards / research"
Good analytics culture in respondents' own words
Spelling and punctuation preserved in the original
"By analytics culture I mean that most departments are focused on efficiency, measure their results through analysts; generate ideas and bring them to life; run tests"
Good analytics culture in respondents' own words
Spelling and punctuation preserved in the original
"Business and management are guided by data when making decisions: Business and product managers understand the importance of analytics and rely on numbers when making decisions, good communication and collaboration between business, product and analysts"
Technologies and skills
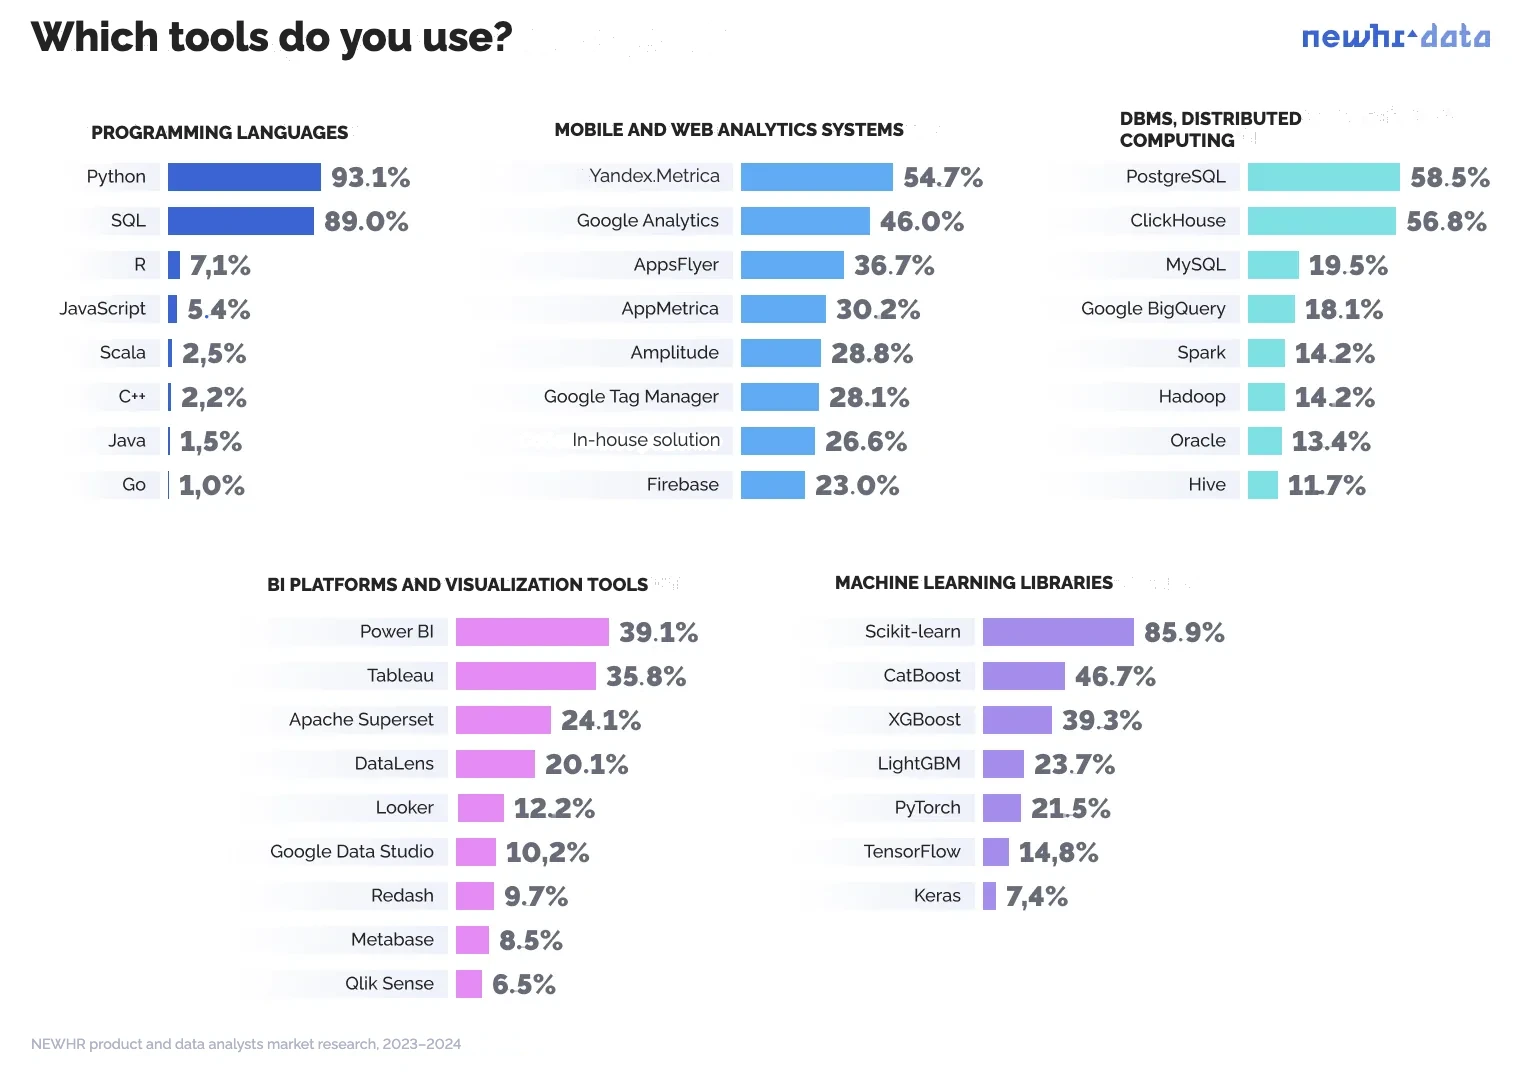
Question: Which programming languages do you use at work?
Number of respondents: 408
Question: Which mobile and web analytics systems do you use at work?
Number of respondents: 139
Question: Which DBMSs or distributed computing systems do you use at work?
Number of respondents: 359
Question: Which BI platforms and visualization tools do you use at work?
Number of respondents: 402
Question: Which ML libraries do you use?
Number of respondents: 135
- Programming languages — 19
- Python — 93.1% | 380 people
- SQL — 89.0% | 363 people
- R — 7.1% | 29 people
- JavaScript — 5.4% | 22 people
- Scala — 2.5% | 10 people
- C++ — 2.2% | 9 people
- Java — 1.5% | 6 people
- Go — 1.0% | 4 people
- Julia — 0.5% | 2 people
- DAX — 0.5% | 2 people
- M (Power Query) — 0.5% | 2 people
- VBA — 0.5% | 2 people
- Appscript — 0.3% | 1 person
- C# — 0.3% | 1 person
- ClickHouse is not just SQL — 0.3% | 1 person
- Groovy — 0.3% | 1 person
- SAS — 0.3% | 1 person
- TypeScript — 0.3% | 1 person
- SPARK — 0.3% | 1 person
- Mobile and web analytics systems — 24
- Yandex.Metrica — 54.7% | 76 people
- Google Analytics — 46.0% | 64 people
- AppsFlyer — 36.7% | 51 people
- AppMetrica — 30.2% | 42 people
- Amplitude — 28.8% | 40 people
- Google Tag Manager — 28.1% | 39 people
- The company's own solution — 28.1% | 38 people
- Firebase — 23.0% | 32 people
- Adjust — 7.9% | 11 people
- FB / Instagram* API — 5.8% | 8 people
- Mixpanel — 3.6% | 5 people
- Devtodev — 1.4% | 2 people
- MyTracker — 1.4% | 2 people
- Piwik — 1.4% | 1 person
- Flurry — 1.4% | 1 person
- Onelink — 1.4% | 1 person
- PostHog — 1.4% | 1 person
- Segment — 1.4% | 1 person
- Swrve — 1.4% | 1 person
- A+ — 1.4% | 1 person
- Matomo — 1.4% | 1 person
- Google Ads API — 1.4% | 1 person
- Google Bigeye — 1.4% | 1 person
- data.ai — 1.4% | 1 person
- DBMSs or distributed computing systems — 32
- PostgreSQL — 58.5% | 210 people
- ClickHouse 56.8% | 204 people
- MySQL — 19.5% | 70 people
- Google BigQuery — 18.1% | 65 people
- Spark — 14.2% | 51 people
- Hadoop — 14.2% | 51 people
- Oracle — 13.4% | 48 people
- Hive — 11.7% | 42 people
- Vertica — 9.2% | 33 people
- OLAP — 7.5% | 27 people
- MongoDB — 7.0% | 25 people
- Trino — 6.1% | 22 people
- Microsoft SQL Server — 5.9% | 21 people
- Elasticsearch — 4.7% | 17 people
- Amazon Redshift — 4.5% | 16 people
- MapReduce — 3.9% | 14 people
- Presto — 3.1% | 11 people
- Greenplum — 2.8% | 10 people
- YT (YTSaurus) — 2.5% | 9 people
- snowflake — 1.4% | 5 people
- AZURE — 0.6% | 2 people
- YQL — 0.6% | 2 people
- Athena — 0.3% | 1 person
- Databricks — 0.3% | 1 person
- Exasol — 0.3% | 1 person
- Impala — 0.3% | 1 person
- MariaDB, Dremio — 0.3% | 1 person
- Cache — 0.3% | 1 person
- Redis — 0.3% | 1 person
- YDB — 0.3% | 1 person
- An add-on on top of ClickHouse — 0.3% | 1 person
- Home-made — 0.3% | 1 person
- BI platforms and visualization tools — 33
- Power BI — 39.1% | 157 people
- Tableau — 35.8% | 144 people
- Apache Superset — 24.1% | 97 people
- DataLens — 20.1% | 81 people
- Looker — 12.2% | 49 people
- Google Looker Studio (formerly Data Studio) — 10.2% | 41 people
- Redash — 9.7% | 39 people
- Metabase — 8.5% | 34 people
- Qlik Sense — 6.5% | 26 people
- Grafana — 1.7% | 7 people
- In-house BI tools — 1.7% | 7 people
- FineBI — 1.7% | 7 people
- Oracle BI — 0.7% | 3 people
- Pentaho — 0.5% | 2 people
- Databricks — 0.5% | 2 people
- Apache Zeppelin — 0.5% | 2 people
- Mode — 0.5% | 2 people
- OpenAnalytics — 0.2% | 1 person
- Amazon QuickSight — 0.2% | 1 person
- Anaplan — 0.2% | 1 person
- Delta — 0.2% | 1 person
- Devexpress — 0.2% | 1 person
- Luxms — 0.2% | 1 person
- Metabase — 0.2% | 1 person
- Polyanalyst — 0.2% | 1 person
- Proceset — 0.2% | 1 person
- QlikView — 0.2% | 1 person
- Quicksight — 0.2% | 1 person
- SAP — 0.2% | 1 person
- SAS — 0.2% | 1 person
- Splunk — 0.2% | 1 person
- Visiology — 0.2% | 1 person
- Other BI — 0.2% | 1 person
- Machine learning libraries — 14
- Scikit-learn — 85.9% | 116 people
- CatBoost — 46.7%| 63 people
- XGBoost — 39.3% | 53 people
- LightGBM — 23.7% | 32 people
- PyTorch — 21.5% | 29 people
- TensorFlow — 14.8% | 20 people
- Keras — 7.4% | 10 people
- Casual ML — 1.5% | 2 people
- Pandas — 1.5% | 2 people
- Numpy — 1.5% | 2 people
- Prophet — 1.5% | 2 people
- Robyn — 0.7% | 1 person
- Libraries for R — 0.7% | 1 person
- retentioneering — 0.7% | 1 person
Top experts
Adapted from the original article in Russian on newhr.org. Read the Russian version.