Market research · October 2024
Analyst market research 2024
NEWHR surveyed 1,293 analysts across 6 specialisations. They told us where they live, which companies they work for, which markets they focus on, how they look for jobs and what they aspire to. And also how much they earn and how their salary has changed.

Kira Kuzmenko
CEO NEWHR
At NEWHR we have been researching the analyst market since 2018, because we consider analytics one of the key professions driving business forward. How the profession is changing, what business wants from analysts and what analysts themselves want, how much analysts cost, which technologies they use: read about all of this in our current study.
In the 2023 study we focused more on product and data analysts, and in the current one we added systems and business analysts, BI analysts and marketing analysts.
I should warn you that this document contains only part of the information; the remaining interesting details (including breakdowns by specialisation) we have packed into a separate dashboard.
You can find our other studies of the IT job market here. We like to rely on data in our work and invite you to do the same with us. Write to us: data@new.hr
About the study
The study was conducted as an online survey. Respondents were recruited through NEWHR's online media, partner channels and our own respondent base.
- 1,293 people made up our sample
The sampling error is 3% at a 95% confidence interval
6 specialisations
- Data analysts
- Product analysts
- BI analysts
- Marketing analysts
- Business and systems analysts
- Heads of analytics
6 grades
- Intern
- Junior
- Middle
- Senior
- Principal
- Team lead
- Head of Analytics
4 types of companies
- Russian
- Partly Russian (operate abroad; founded by people from Russian-speaking markets)
- Foreign local (operate in the market of a single country)
- Foreign international (operate in many countries)
The study is most representative for data analysts and product analysts. See the section "Who are all these people"
Key findings
1 Analysts' salaries kept growing (69%)
In 2024, unlike 2023, salaries grew faster in Russian companies. But analysts' income in Russian companies did not become higher than in foreign ones: salaries there are more often higher. The active salary growth in Russian companies in 2024 is rather a case of catching up.
2 A good salary is what keeps analysts at a company now
In 2024 salary became one of the decisive factors in retaining analysts. The importance of salary as a factor of loyalty to the employer doubled in 2024 compared with 2023: from 25% to 52%.
3 Foreign companies have become less attractive to analysts from Russian companies
This breaks the 2022−2023 trend. Our respondents have started to focus more on the market that is closer to them: in Russia, on the Russian market; abroad, on the foreign market. Analysts in the near abroad are at a crossroads: although they prefer foreign employers, they are also interested in Russian ones.
4 A drop in interest in job hunting
At the end of 2024 analysts are much more loyal to their current job (46%) than they were a year earlier (35%). Whether this is a trend we will see in a year. The lower interest in changing jobs has not affected interest in interviews. In both 2023 and 2024, three out of five analysts went to interviews: monitoring the market is a stable need.
5 Avito has become the most attractive employer for analysts
Even when positive and negative attitudes are weighed against each other, at the end of 2024 Avito keeps first place among large Russian companies. Yandex and T-Bank, although they remain in the group of leaders, became significantly less attractive in 2024.
6 There is less office work
Despite the international post-COVID scare story of "everyone is being herded back to the office", we do not see such a trend among Russian-speaking analysts. The most common work format is remote (51.6%). The format analysts themselves prefer most is hybrid.
7 Men and women are equally represented in analytics, but the "glass ceiling" has not been broken
For Russian-speaking IT, analytics is the profession closest to equal gender representation. However, gender inequality is pronounced here. First, the share of women is much smaller in leadership positions. Second, they earn less than male analysts both on average and in the same positions and grades.
Respondent profile
Who are all these people
For Russian-speaking IT, analytics is a relatively young profession, but not a new one; it is quite mature.
The typical age range of analysts is from 21 to 40 (88.3%). More than half of analysts are aged 26−36 (56.5%). But the profession also has a significant share of specialists aged 41 to 55 (10.6%).
Among IT professions, analytics is the closest to equal gender representation. Of 1,293 people, 53% are men and 47% are women.
21-40 years old 88.3%
- The typical age range of analysts
26-30 years old 31.3%
The most common age of an analyst
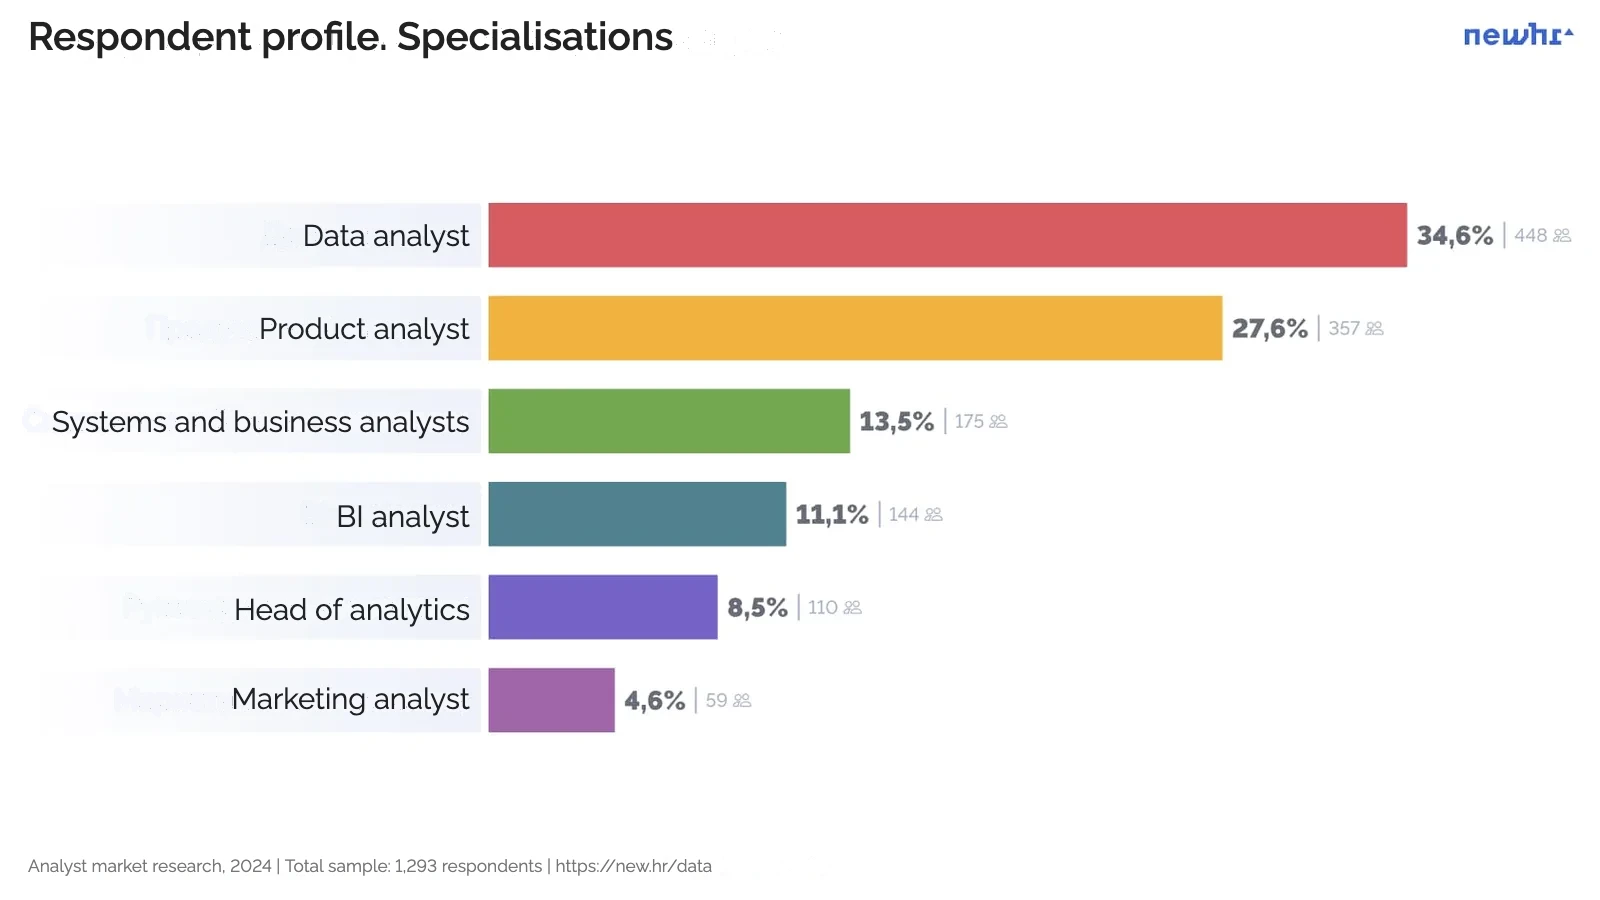
Question: How would you describe your main professional specialisation in analytics?
Number of respondents: 1,293
Our sample covers 6 analyst specialisations, including heads of analytics.
We singled out management as a separate specialisation for cases when our respondents manage a team and may be responsible for several areas of analytics, so such a specialist cannot be assigned to any narrow analytical specialisation.
- Data analysts have the most equal representation of men and women: 49% women to 51% men.
- Among systems analysts, business analysts and marketing analysts there are slightly more women (on average 55% to 45%).
- Among product and BI analysts there are slightly more men: on average 47% to 53%.
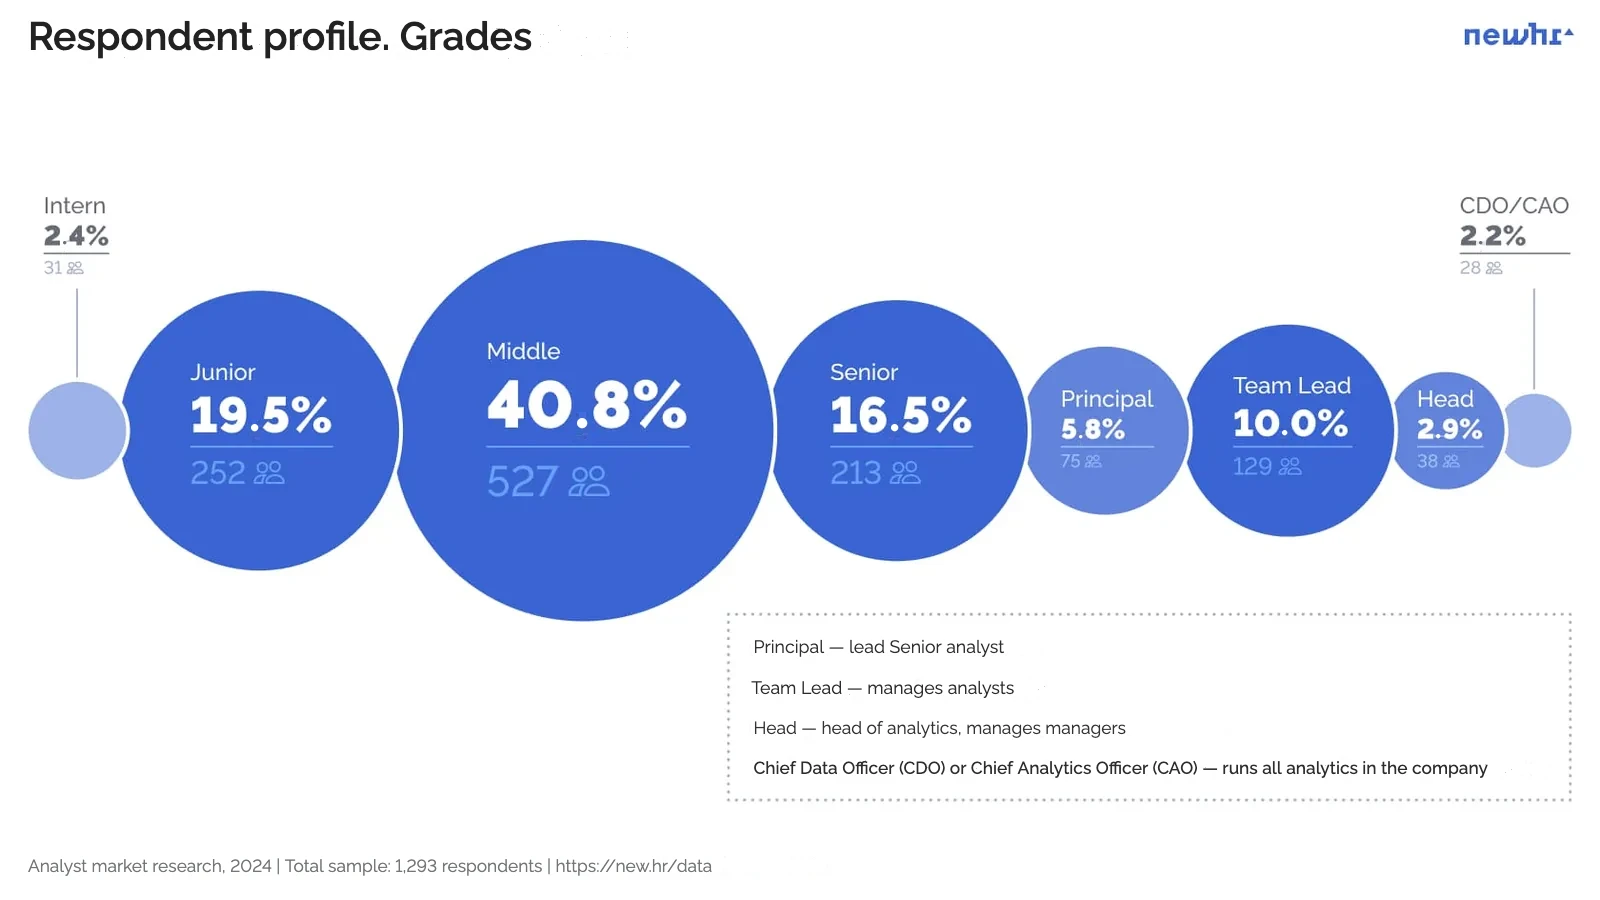
Question: What is your grade?
Number of respondents: 1,293
The sample matches the structure of the market and covers all grades.
Question: How long have you worked in this specialisation?
Number of respondents: 1,293
Different lengths of experience in the profession are evenly represented among respondents. The picture corresponds to a normal, mature market.
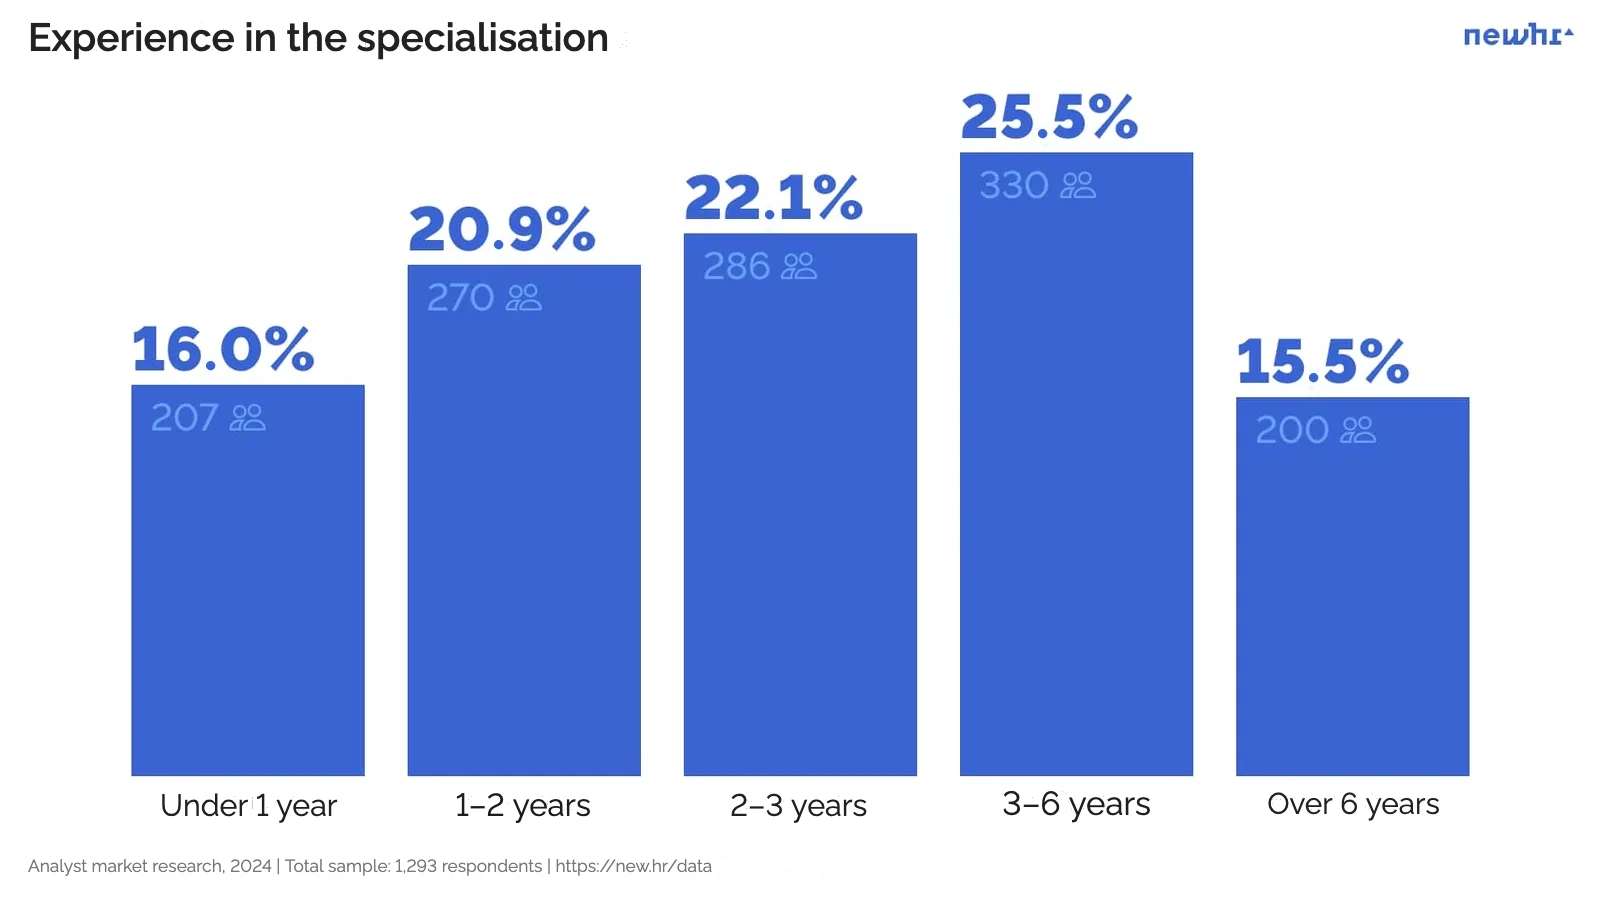
Among analysts with little experience (under 1 year, 1−3 years) data analysts are the largest group. Systems and business analysts have more mature experience: 3 years and more, over 6.
And, of course, analytics managers are mostly people with solid professional and managerial experience.
Based on these data, we can assume that data analytics is a possible way into the profession. And as they grow professionally, analysts often move to another analytical specialisation and start developing in it in a more focused way.
Work tasks
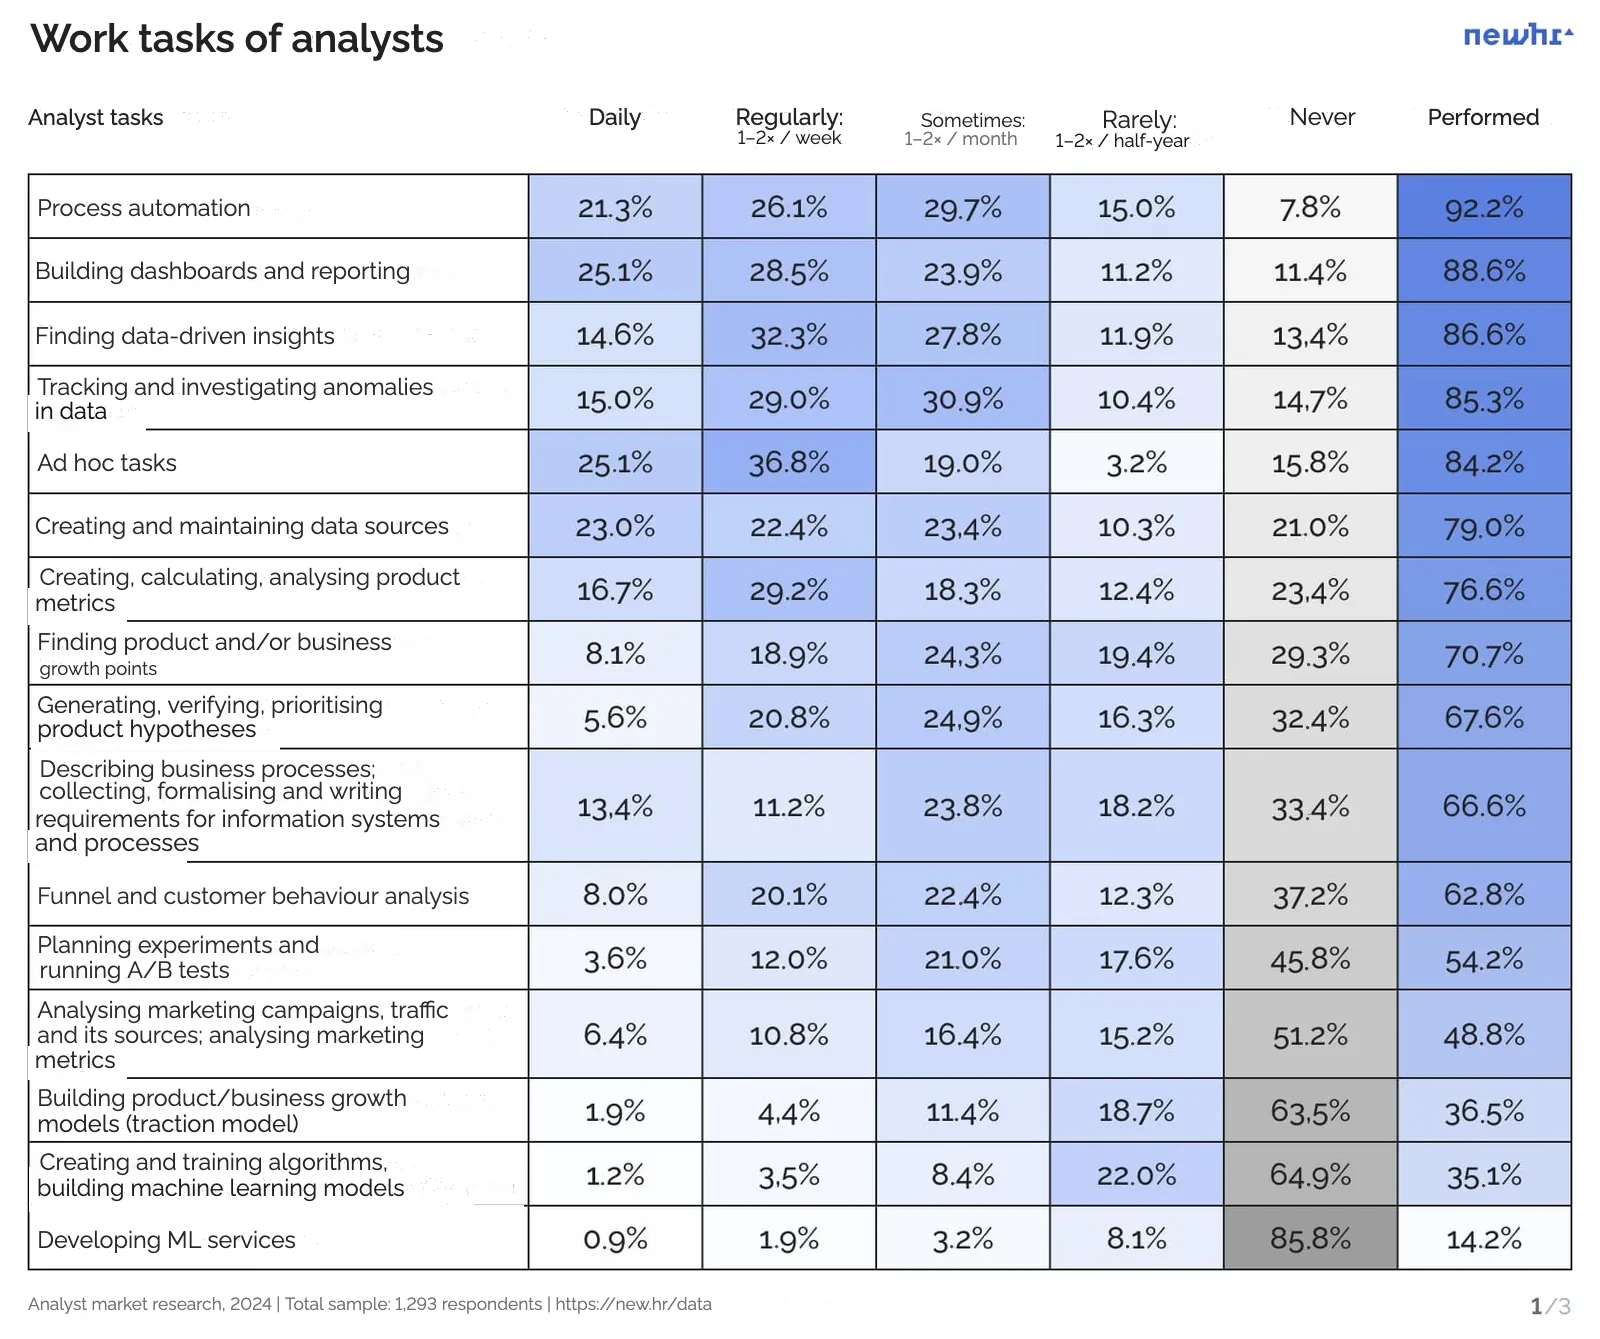
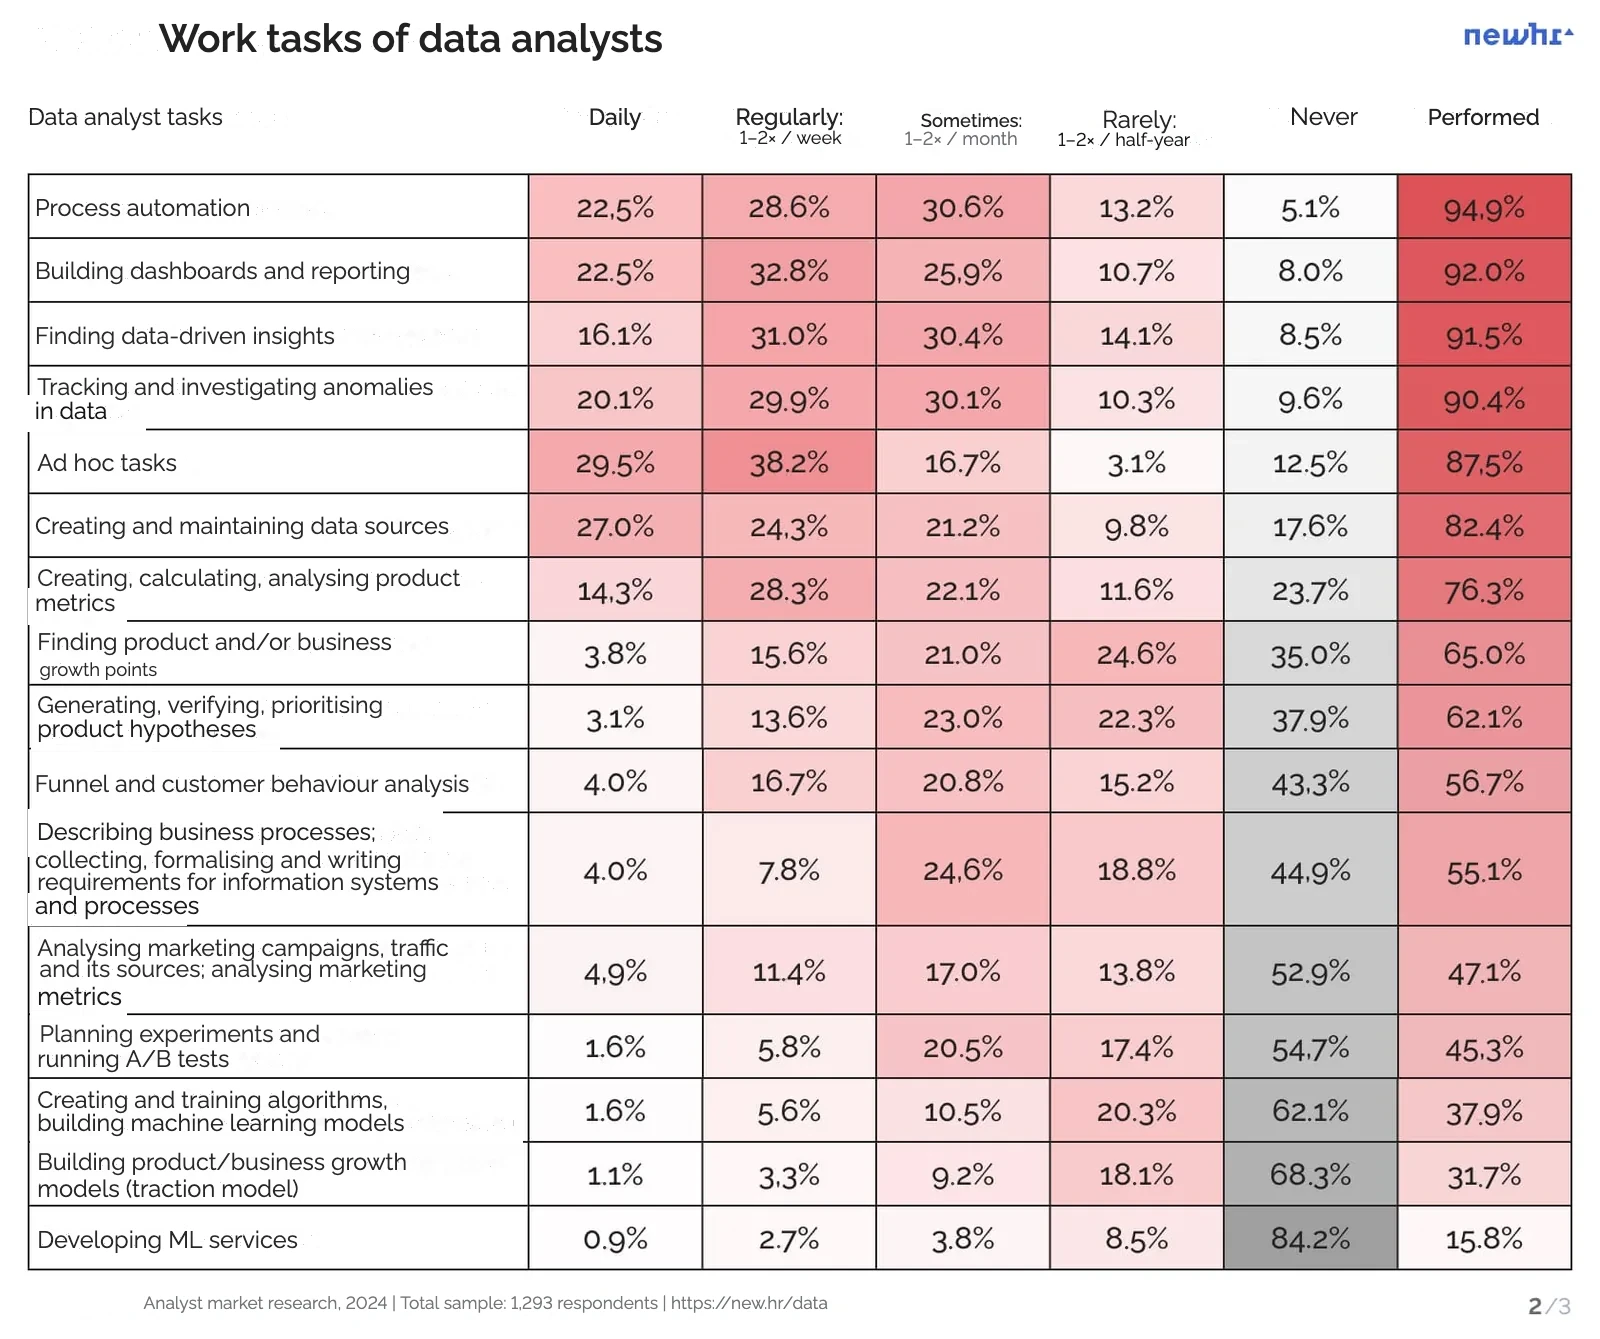
All analysts do this…
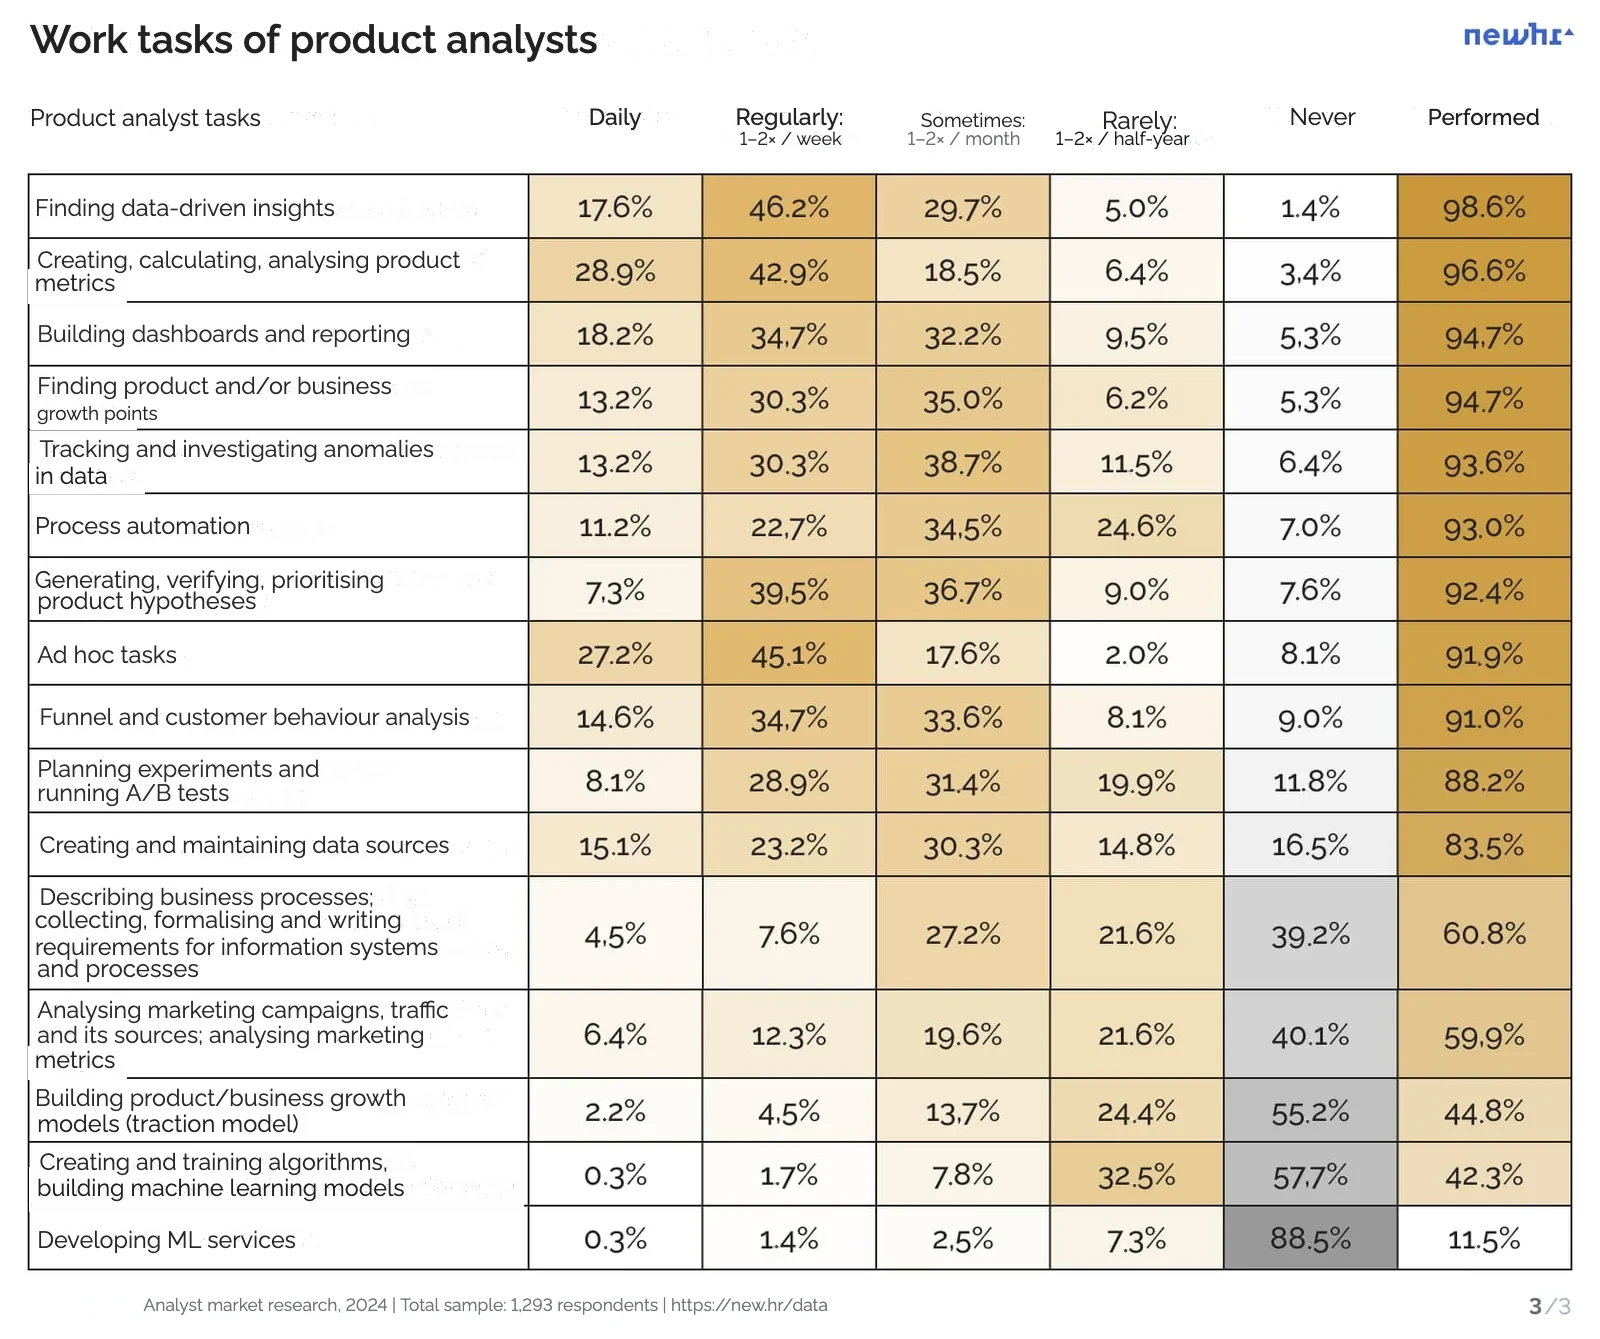
Question: What are the main analytics tasks within your area of responsibility?
*Number of respondents: 1,293 (gr. 1)
Data analysts: 448 (gr. 2)
Product analysts: 357 (gr. 3)*
- Process automation — 92%
- Building dashboards and reporting — 89%
- Finding data-driven insights — 87%
- Tracking anomalies in data — 85%
- Ad hoc tasks — 84%
Locations and relocation plans
The urge to move
Question: Where do you live permanently / for most of the year / work from?
Number of respondents: 1,293
The study reflects the views of Russian-speaking analysts living in Russia and outside it. Compared with last year, the share of specialists from Russia is higher this time (70% vs. 61% last year).
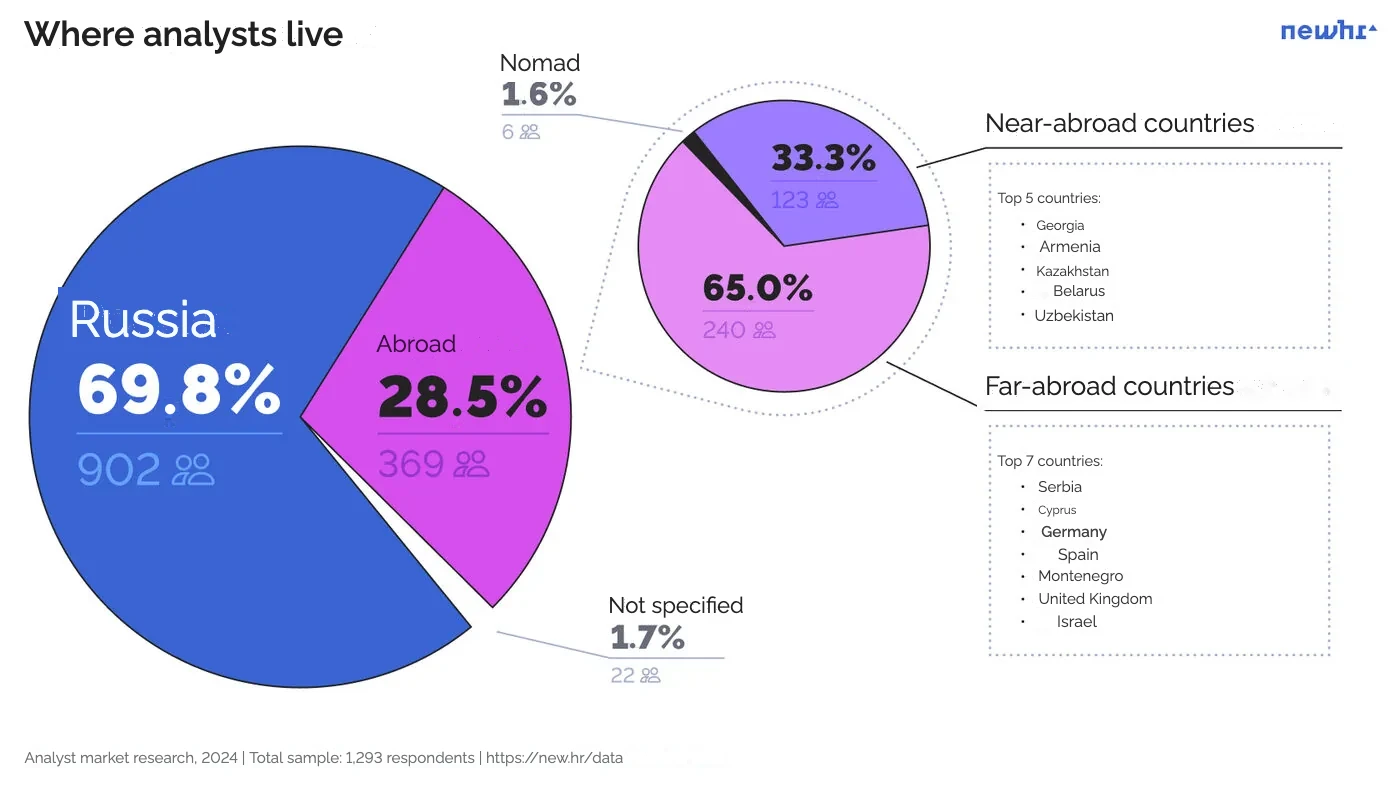
Among those abroad, there are more analysts in the far abroad (⅔) than in the near abroad (⅓). Most often they live in Serbia, Cyprus, Georgia, Armenia, Kazakhstan, Germany, Uzbekistan, Spain and Montenegro.
Turkey, which in 2022 was still among the leading countries, has finally stopped being a destination for Russian-speaking analysts.
Overall, Russian-speaking analysts form a wide diaspora: 10 countries of the near abroad and 36 countries of the far abroad.
The most "foreign" specialisations in our sample are product analysts (65% in Russia and 33% abroad) and marketing analysts (66% in Russia and 32% abroad). And the most "Russian" specialisation is BI analysts (81% in Russia and 19% abroad).
Oksana Prutyanova
Head of analyst
and data scientist search at NEWHR
"The international market does not differentiate analytics specialisations the way Russia and the post-Soviet space do. So some analytical areas that are separated out in Russia (BI analytics, for example) are merged in international companies into a more general role title (Analyst or Data scientist), or are given other local names."
Question: Are you planning to move to another country in the next 1−1.5 years?
Number of respondents: 1,293
More than half of analysts (56.6%) do not plan to move to another country in the next year to year and a half, regardless of where they are now.
Over the past year people's desire to relocate has decreased: both the share of those planning to move and the share of those considering it have shrunk. While at the end of 2023 every 4th analyst planned to change country, at the end of 2024 it was only every 6th (see the 2023 study of the product and data analyst market).
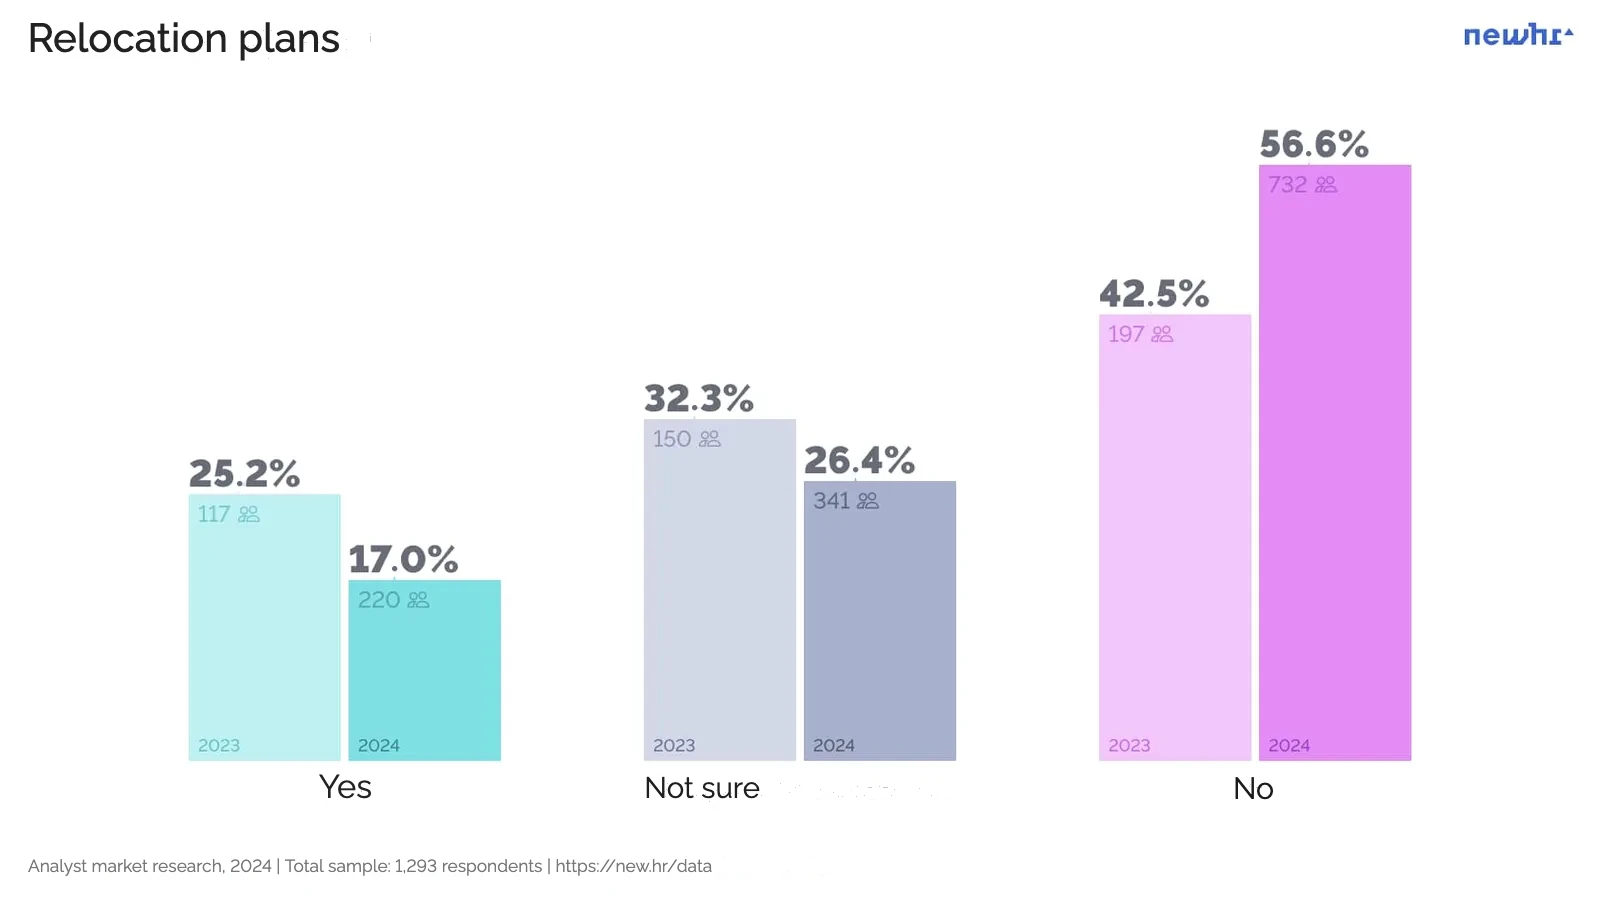
The decline in interest in relocation is first and foremost a decline in interest in emigration among those living in Russia. 62% of respondents living in Russia have no plans to move to another country and only 10% have such plans.
The far abroad has also calmed down but remains mobile: 54% of respondents do not plan to leave, but 26% do.
Specialists from the near abroad consider relocation most often. A quarter (24%) want to settle for a year or a year and a half, and half (49%) want to move. They may move either to Russia or to countries of the far abroad.
Specialisation does not correlate with relocation behaviour as strongly as place of residence does. Apart from specialisation, many other factors shape an analyst's relocation choice (grade, income, company type and other factors not covered by the survey).
It is interesting to note that the most "settled" specialisation in our sample is marketing analysts (10% plan to move, 63% do not), and the most "nomadic" are systems and business analysts (18% plan to move, 53% do not) and data analysts (18.5% plan to move, 56% do not).
Oksana Prutyanova
Head of analyst
and data scientist search at NEWHR
"Russian employers should not write off those who are in the near abroad. These countries are a kind of buffer zone from which analysts can be 'hunted'. People in this 'hunting zone' are more willing to talk to employers from Russia than in 2022 and 2023. Meanwhile, analysts in the far abroad have become practically out of reach for Russian employers, especially if they already work for international companies."
Where they work
We divided companies into 4 types, taking into account how Russian-speaking analysts are currently distributed across the job market.
- Russian — The company is located in Russia, was founded in Russia, or is the Russian office of a foreign company
Example: Sberbank - Partly Russian — The company has Russian roots but operates in a foreign market; the team is generally Russian-speaking/international
Example: inDrive - Foreign international — A foreign company whose team is mostly international
Example: Amazon - Foreign local — A foreign company whose team is mostly local specialists speaking the local language
Example: Uzum
Question: Can your employer be called a Russian company?
Number of respondents: 1,293
Most Russian-speaking analysts work for Russian companies: 75.9%.
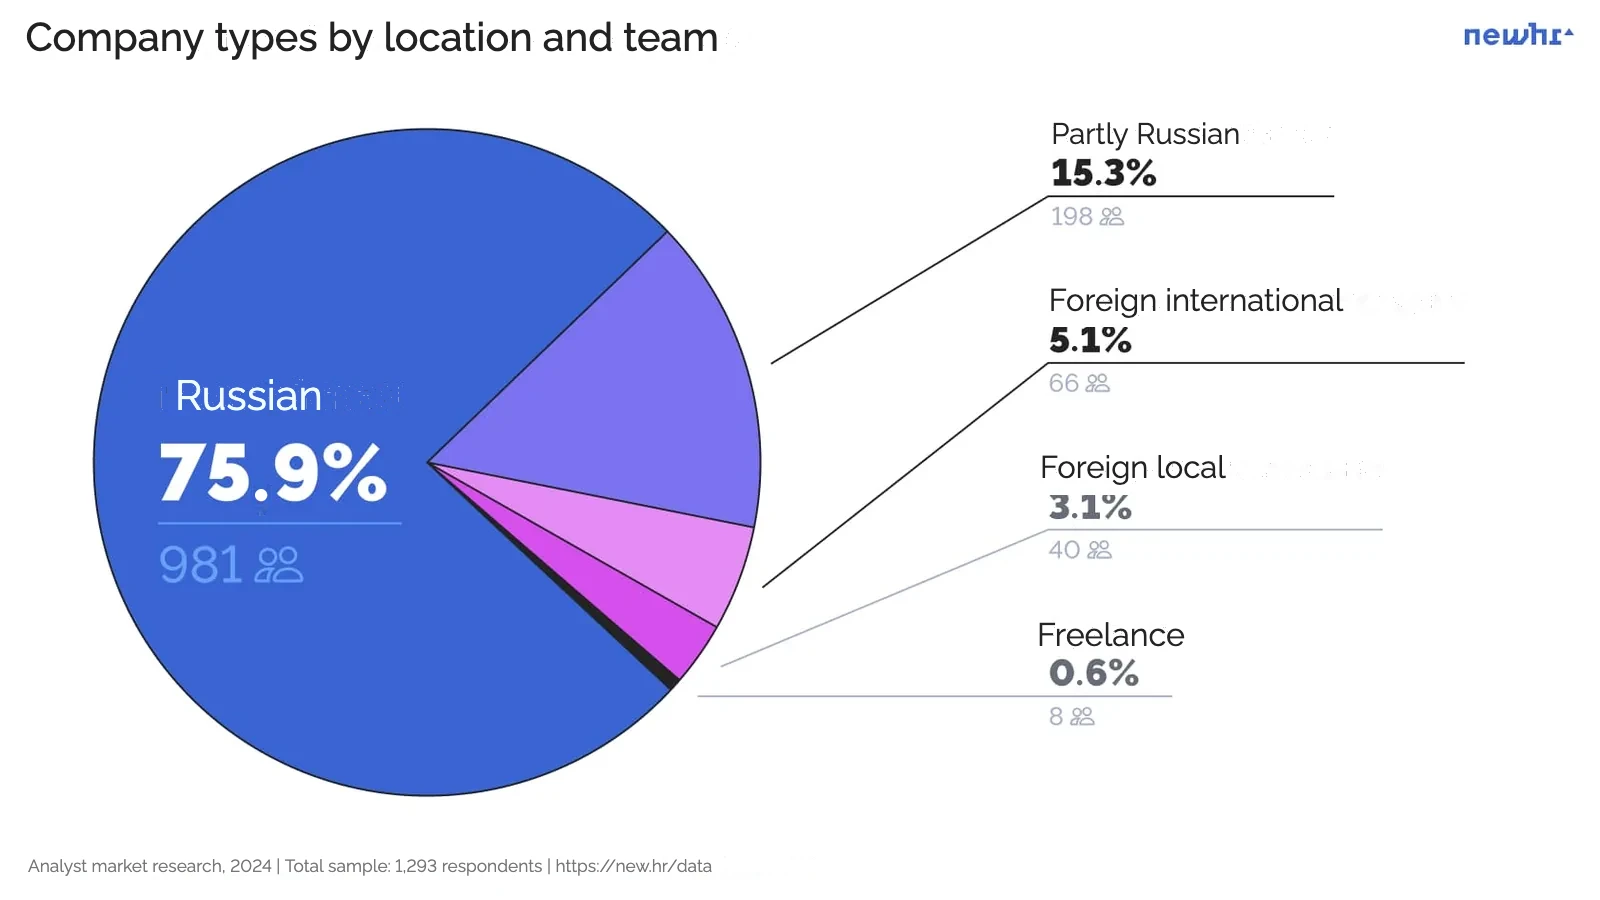
Over 2022−2023 the share of "partly Russian" employers grew. These are companies with Russian roots that operate in foreign markets and whose office is located outside Russia. But by the end of 2024 the share of these companies among our respondents became smaller: it fell from 21.6% to 15.3%. The share of purely Russian companies grew from 69.6% to 75.9%.
We see the share of "partly Russian" companies narrowing. This conclusion is not just a feature of our sample: it is also visible in other metrics. This may be a trend of people flowing from "partly Russian" companies either back to Russian ones or to foreign ones. We will keep an eye on it in next year's studies.
Seniors have a better chance of ending up in foreign companies: they are best represented there, especially in foreign international companies. Junior grades and managers more often work in Russian companies.
The foreign local companies in our sample are mostly companies from the near abroad (Uzbekistan, Kazakhstan, Belarus, Tajikistan and others). Of the far-abroad companies, respondents most often mentioned German ones.
Office or remote
Question: What format do you work in?
Number of respondents: 1,293
Question: Which work format do you prefer?
Number of respondents: 1,293
The most common format analysts work in is remote (51.6%). Note that of the remote workers, two out of three work in the same country where the company is located, and one in three works for a company from abroad.
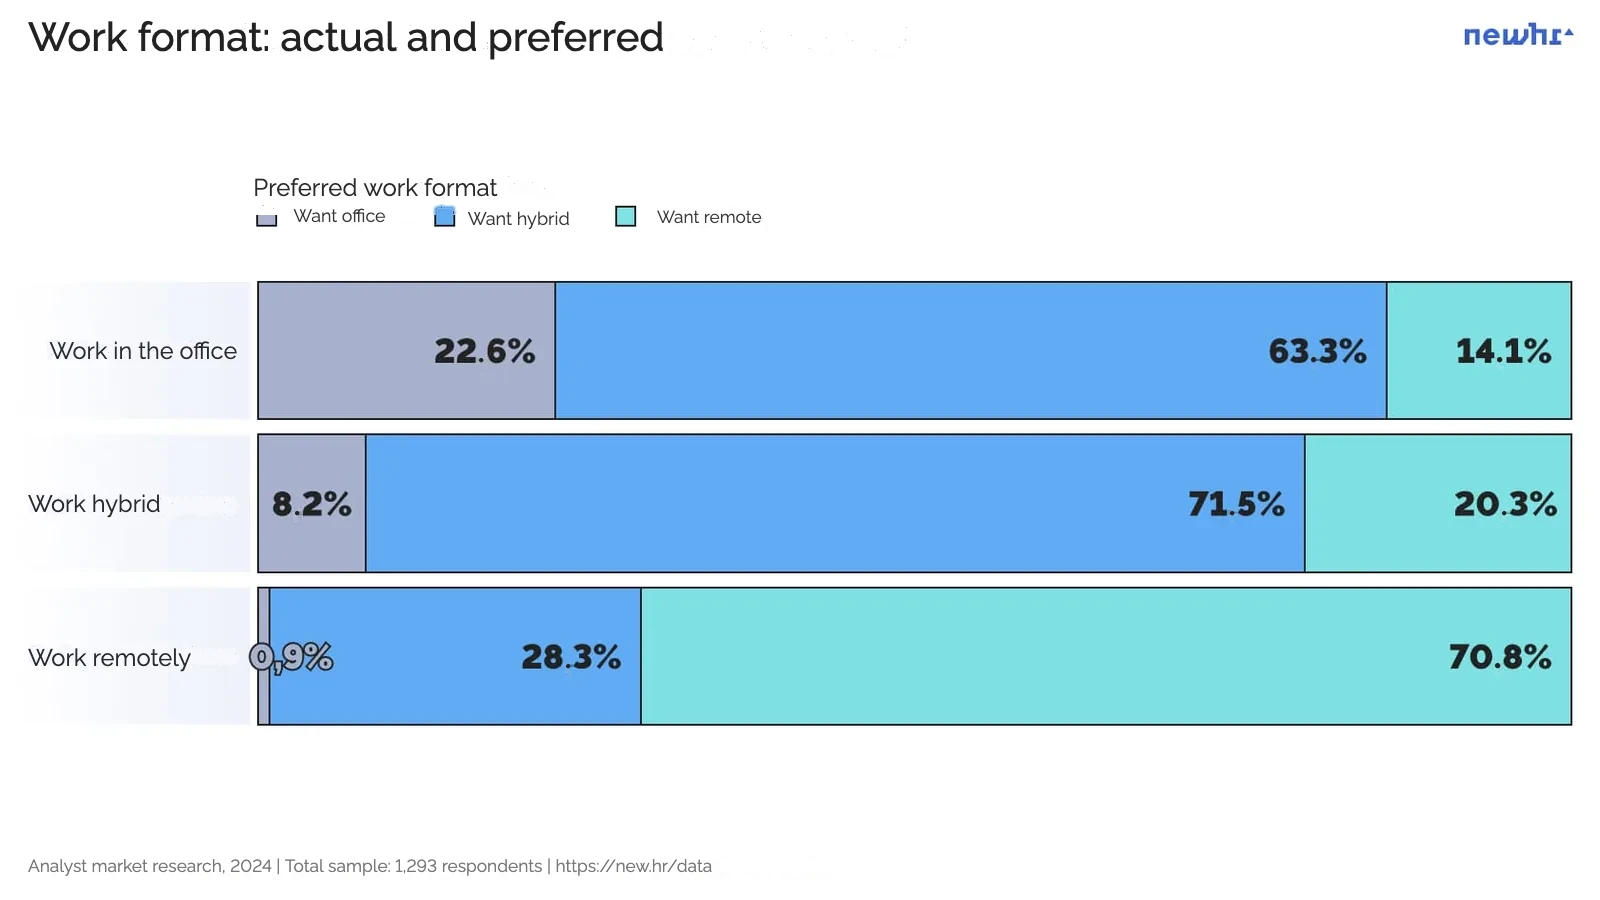
The most preferred option is hybrid (48% of the whole sample), slightly ahead, by 2.5%, of remote (45.5%).
The office is in the absolute minority: 13.7%.
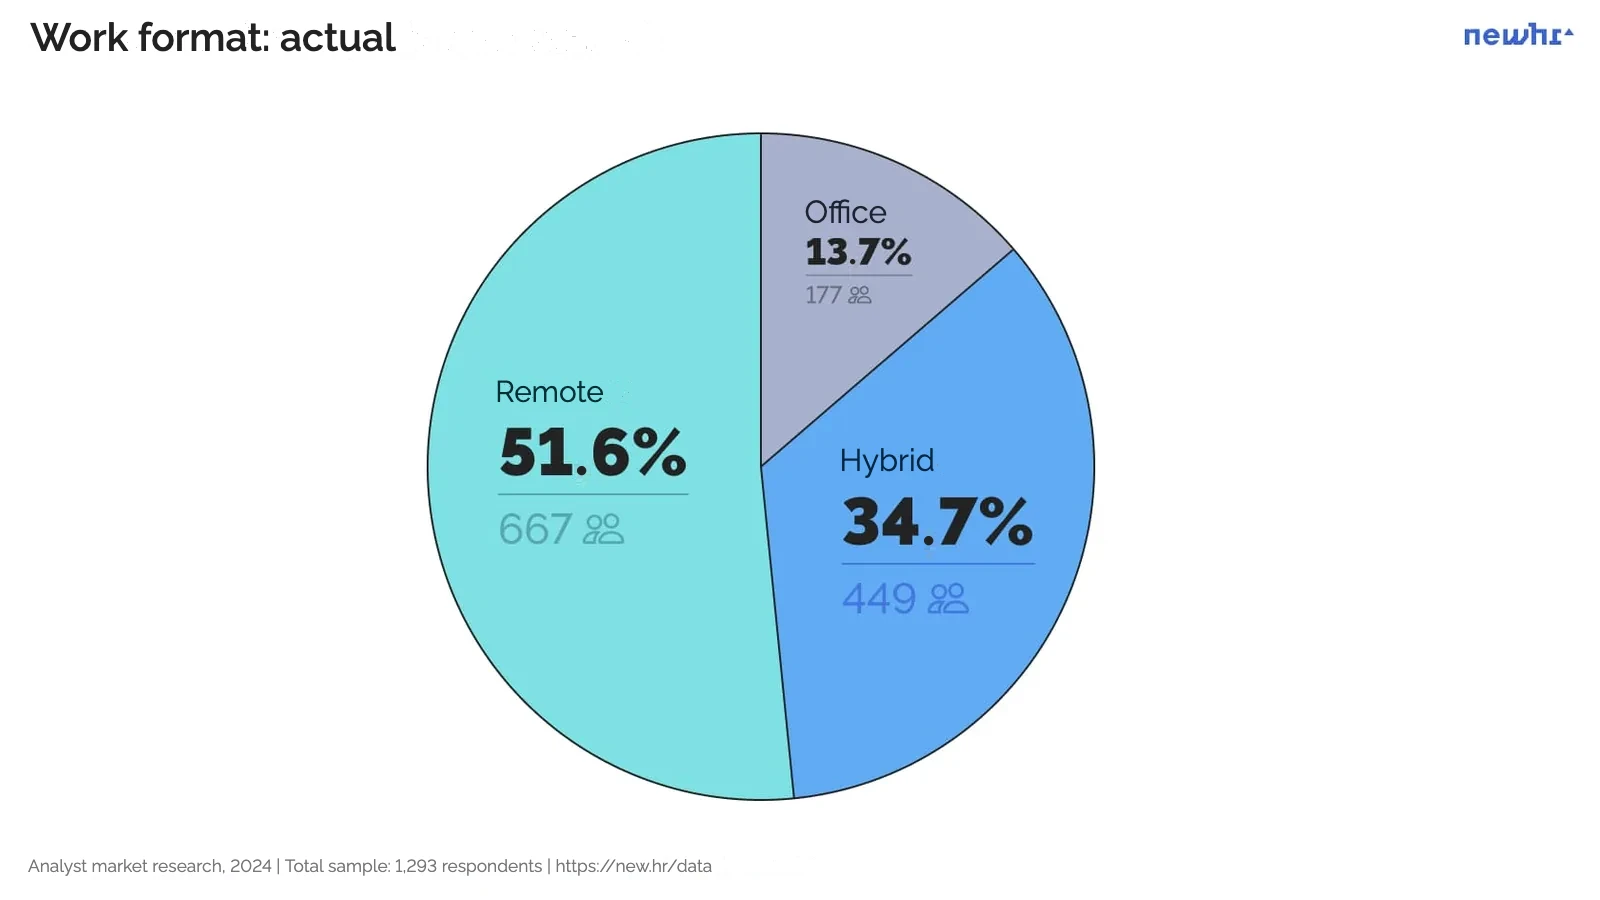
Despite the international post-COVID scare story of "everyone is being herded back to the office", the situation among Russian-speaking analysts seems to be different.
Analysts themselves show no desire to go to the office. Last year 8% of respondents would have preferred the office, and this year 6.4%. Even among analysts who work in the office, only 22.6% would like to keep working that way, and the majority (71.5%) want hybrid. Managers and juniors work in the office most often (levels for which it is hard to work away from the office). Among other positions there are practically no fans of this format.
70% of analysts on hybrid and remote (hybrid 71.5%, remote 70.8%) are happy with their format and want to keep working this way.
If you work for a Russian company in the Russian market, you will most often, and with equal chances, be offered hybrid (37%) or remote work from Russia (38%). In 11% of cases there is a chance to work remotely from abroad, though perhaps not entirely openly.
The least pure office work can be expected in foreign international companies (3%); there you will most often work in a hybrid format: 47%.
In the "partly Russian" company zone, the most likely option is working remotely from another country (44.4%). In total, the largest share works remotely there (71.2%), and only a fifth enjoy hybrid (20%).
Number of jobs
Question: Do you work for one employer or combine work for several employers?
Number of respondents: 1,273
92%
- One employer
7%
- Two employers
1%
Three or more employers
The absolute norm for an analyst is to work for one employer (92% of working analysts, 1,273 people). 6.8% work for two employers, and three employers is a rare case for 1.2%. The situation has not changed since 2023: 91.8%, 7.1%, 1.1% of working analysts. Most likely this golden ratio will not change in 2025 either, but we will watch whether analysts break away from it.
Differences by specialisation are not very significant. There are almost no differences by company type or respondents' gender. If you work for a foreign local company, you are more likely to have a side job. Whether you are a woman or a man does not affect whether you take side work at all; it is practically the same. Among those with side jobs, women more often stop at two jobs, while men take on more jobs more often than women.
Product and data analysts are slightly more inclined to limit themselves to one employer (94−93% have one employer, 6−7% more than one); marketing analysts take advantage of side-job opportunities more often (88% have one employer, 12% more than one).
Oksana Prutyanova
Head of analyst
and data scientist search at NEWHR
"Marketing analysts are less tied to a specific product, their tools are universal and their tasks are rather applied. This lets employers hire marketing analysts part-time more often, rather than taking them on staff full-time."
- If you are a junior or a team lead, you are the least likely to combine two or more jobs: 6.4% of juniors and 5.5% of team leads. Work takes up too much.
- Those who combine jobs most often, and to almost the same degree, are of course seniors (9%) and also middles (8.3%).
- The most active side-jobbers are interns, who need to build a portfolio and experience: 17%.
- Top managers are close to average values: 7.7% of them have more than one job. They have two jobs more often not because they need to build experience or money, but because of high demand on the market. They are more often brought in for consulting.
Analysts' income
About money
Question: How did your salary change in 2024?
Number of respondents: 1,272
Question: How much did your salary increase over the last year?
Number of respondents: 891
Question: How much did your salary decrease over the last year?
Number of respondents: 26
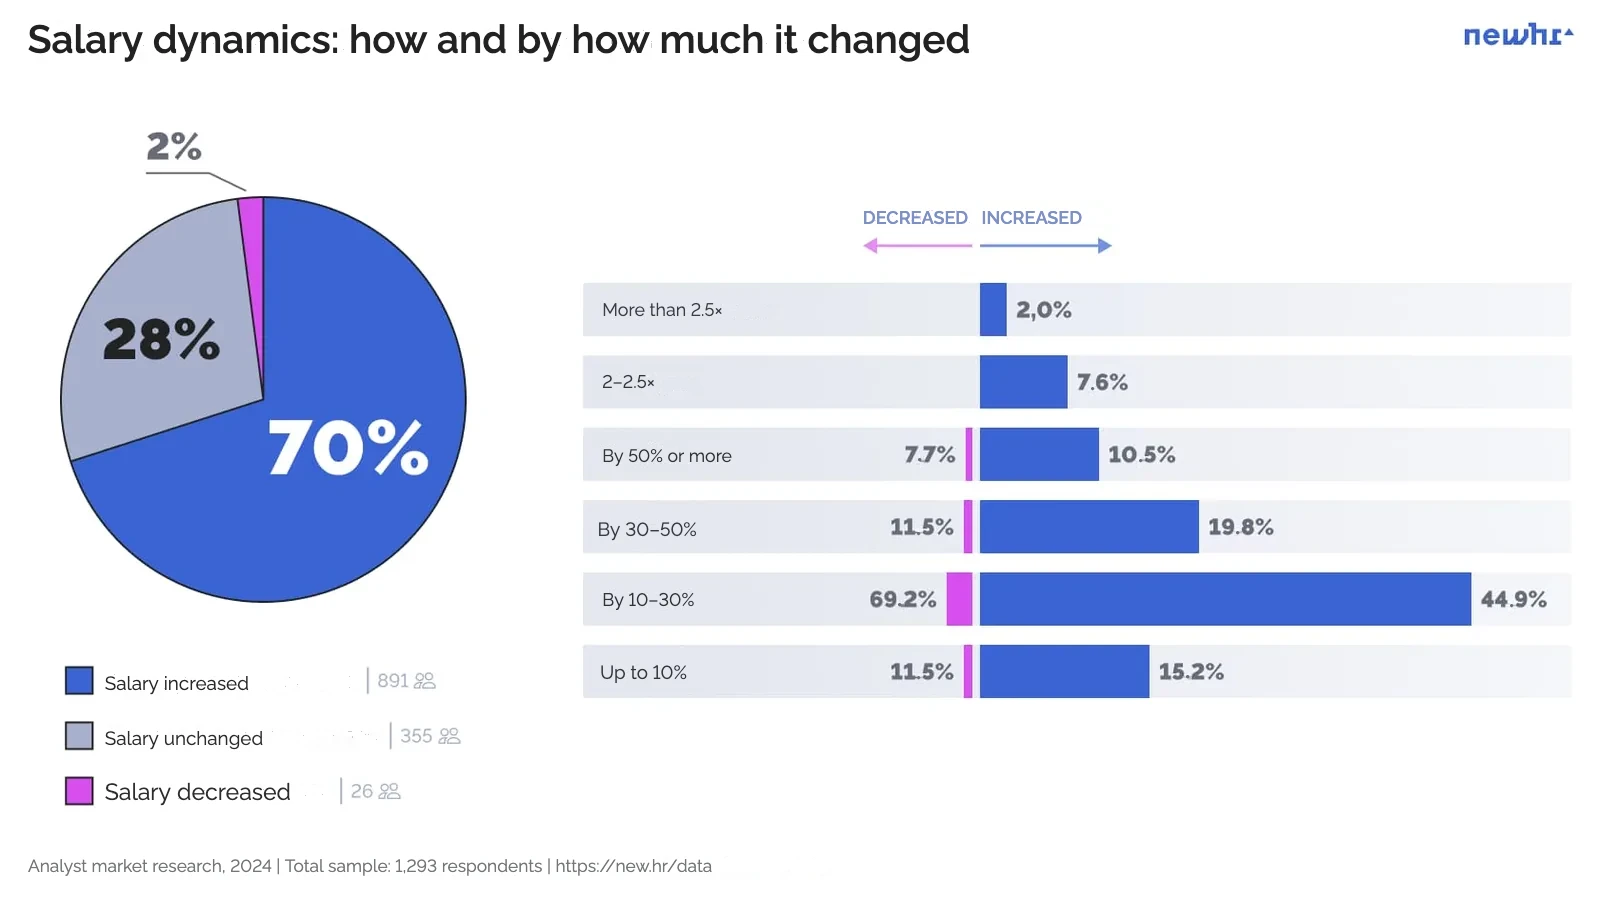
- started earning more: 70% (vs. 68% in 2023)
- stayed on the same salary: 28% (vs. 29% in 2023)
- started earning less: 2% (vs. 3% in 2023)
- Marketing analysts' salaries grew more often (86.4%), stagnated less (13.6%) and did not decrease at all.
- Product, BI and data analysts were in the middle: 70−73% growth, 24−28% stagnation and 1−3% decrease.
- Heads in our sample saw no salary cuts, but their salaries did not grow as often either: 66%, with 34% stagnation.
- Systems and business analysts had the comparatively most stable situation: only 59.2% growth, 38.5% stagnation, 2.4% decrease.
Alena Makarova
Head of research
at NEWHR
"But this does not mean that, as a result, the income of employees in Russia became higher. Salaries grew more often, but they grew against the background of inflation, and in other types of companies they also grew, albeit somewhat more calmly."
Question: On what grounds and under what conditions did your salary increase?
Number of respondents: 891
Question: On what grounds and under what conditions did your salary decrease?
Number of respondents: 26
- Most often a salary increase is linked to changing companies (34.3% of those whose salary grew).
- Other frequent circumstances: a grade change (27.6%), indexation for all company employees (24.2%), Performance Review (22.9%).
- Among individual cases described in detail by our respondents, notable ones are situations where an analyst simply went and talked to their manager and persuaded them to raise their salary (2 people), and a situation with staff turnover in the company (1 person).
"At some point I was left alone in the department, and they raised my salary so that I wouldn't leave too."
- Salary decreases, just like increases, are linked specifically to changing companies (61.5%), especially if the person takes a lower position (15.4%) or changes profession (15.4%).
- Respondents perceive as an actual salary cut a situation where taxes rise as a result of a change of jurisdiction, and the real income left after paying them falls.
Grounds for changes in analysts' salaries in 2024
Top significant grounds for a salary increase
Number of respondents: 891
Multiple choice
- Changing company — 34.3% | 306 people
- Grade change — 27.6% | 246
- Indexation (for all company employees) — 24.2% | 216
- Following a Performance Review — 22.9% | 204
- Salary increase in the company for the current position — 17.4% | 155
- Change in scope of responsibility — 15.4% | 137
- One-off payments from the company — 5.6% | 50
- Change of profession — 4.3% | 38
- Change of project or department — 4.0% | 36
- Counteroffer — 3.9% | 35
Grounds for a salary decrease
Number of respondents: 26
Multiple choice
- Changing company — 61.5% | 16 people
- Change of position — 15.4% | 4
- Change of profession — 15.4% | 4
- Salary cuts in the company for the current position — 11.5% | 3
- Change of project or department — 11.5% | 3
- The company became a foreign legal entity, the share of tax deductions from salary grew — 7.7% | 2
- Following a Performance Review — 3.8% | 1
- Decline in company revenue — 3.8% | 1
Which part of the salary changed
Question: Which part of your salary increased?
Number of respondents: 891
Multiple choice
Question: Which part of your salary decreased?
Number of respondents: 26
Multiple choice
When a salary goes up, the fixed part is almost always increased (94%), and in most cases only that part. Only in 16% of cases is the bonus part increased as well. In just 6% of cases the increase affects bonuses alone.
When a salary goes down, it is also mostly the fixed part that decreases (73%); 27% of respondents noted that the bonus part decreased.
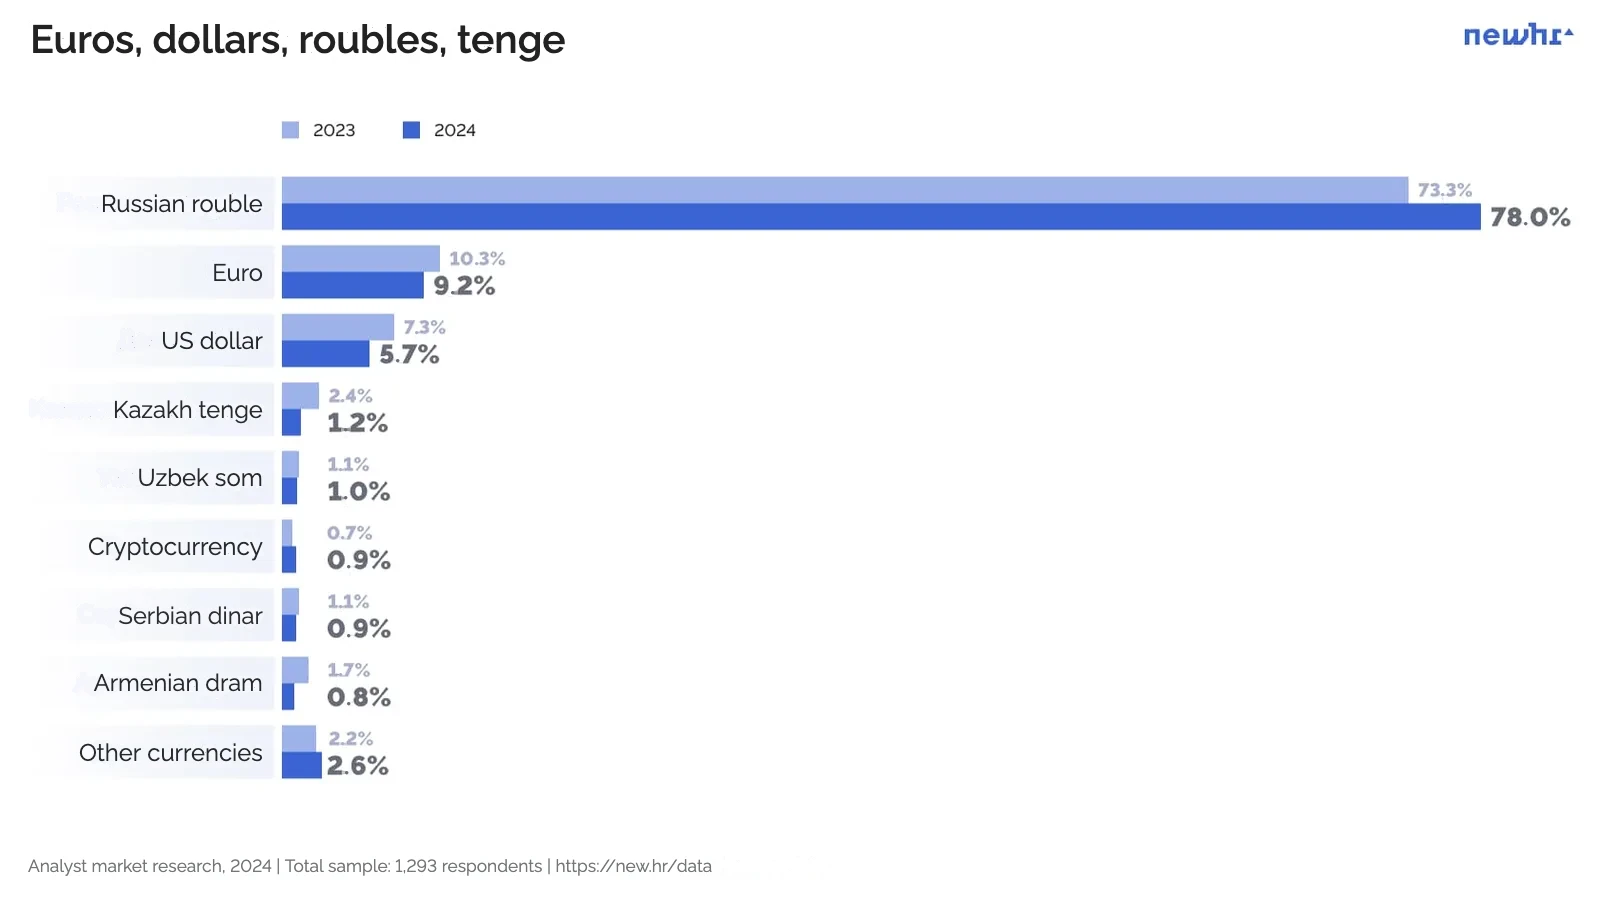
Question: In which currency do you receive your salary?
Number of respondents: 1,278
The vast majority of Russian-speaking analysts (78%) are paid in roubles, which on the whole matches both their place of residence and the types of employer companies.
- 2023
- 2024
- 1
- Kazakh tenge
- KZT
- Kazakh tenge
- KZT
- 2
- Armenian dram
- AMD
- Uzbek som
- UZS
- 3
- Serbian dinar
- RSD
- Cryptocurrency
- 4
- Uzbek som
- UZS
- Serbian dinar
- RSD
- 5
- Cryptocurrency
- Armenian dram
- AMD
Alena Makarova
Head of research
at NEWHR
"6% of respondents from Russian companies are paid in currencies other than roubles: 2 respondents are paid in dollars, 4 in euros, and another 14 respondents in other foreign currencies.
Every third employee of 'partly Russian' companies is still paid in roubles despite being located abroad. 10% of analysts from purely foreign companies also receive their salary in the Russian currency."
Salaries based on the study
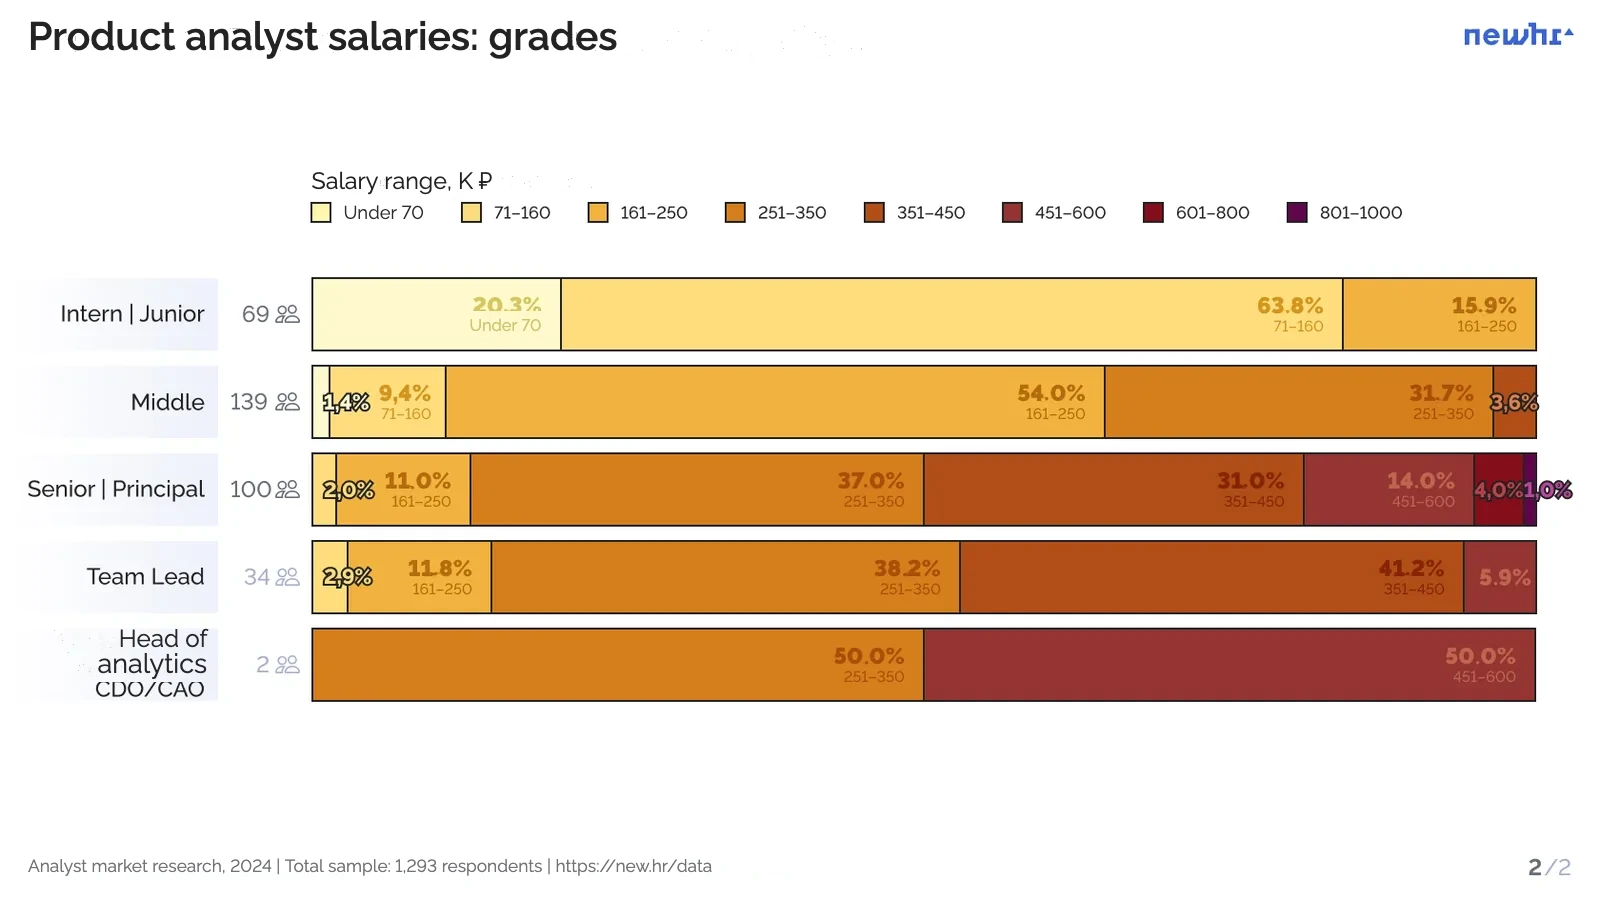
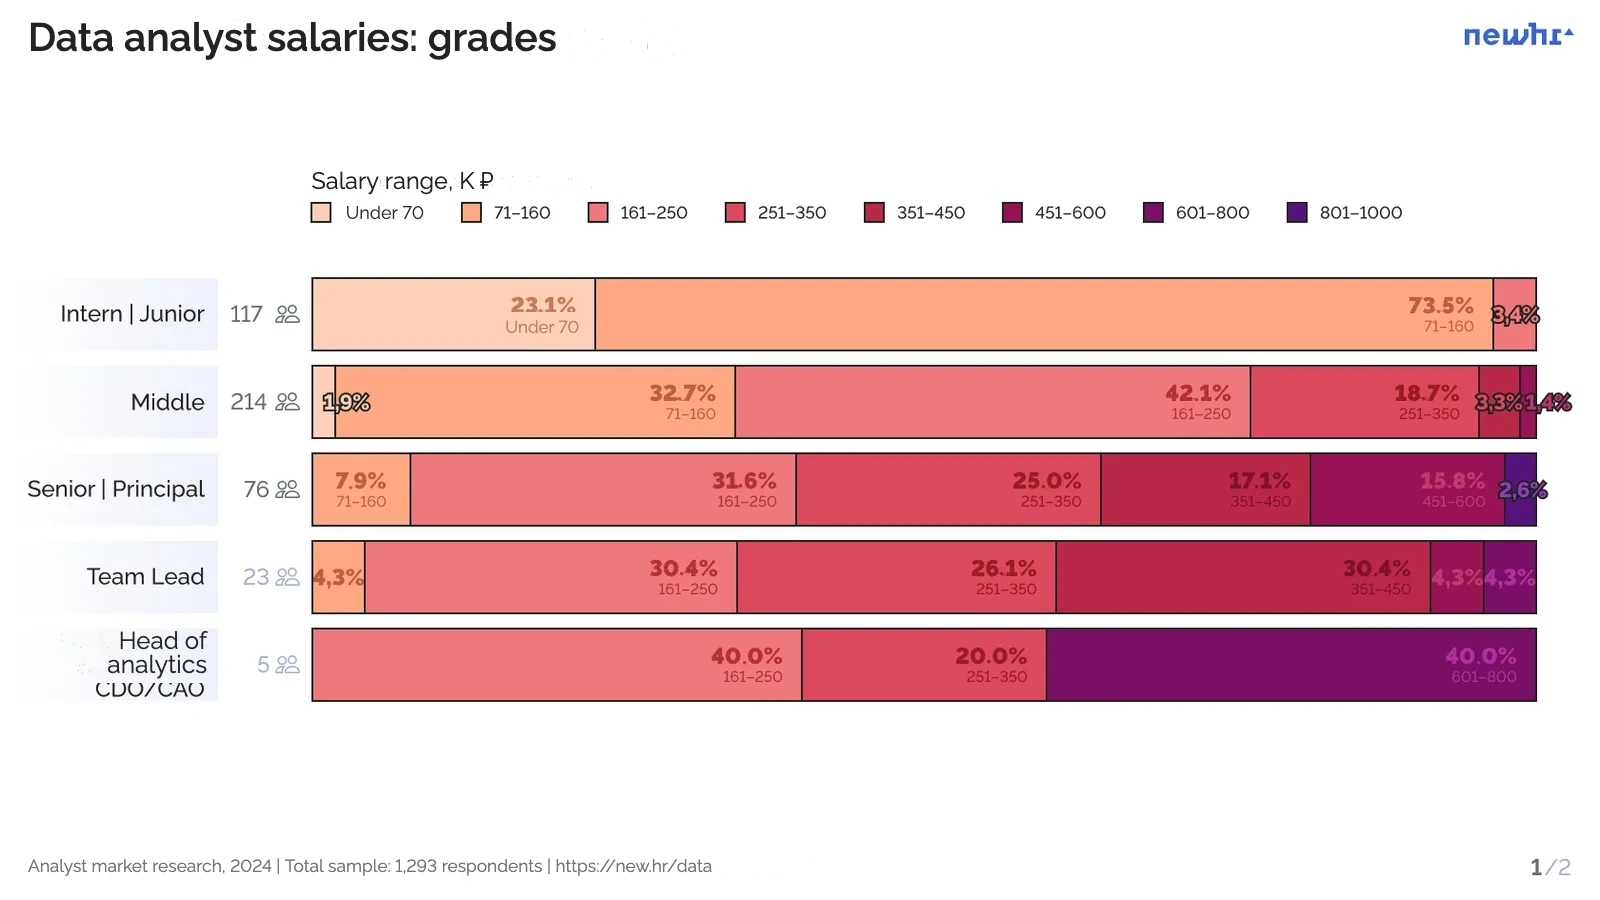
Question: What is your current monthly base salary (in roubles, net, excluding bonuses)?
*Number of respondents: 1,293
Stated their salary: 1,248
Data analysts: 435 (gr. 1)
Product analysts: 344 (gr. 2)*
For the respondents' safety, we collected salary data by offering a choice of fairly wide ranges rather than an exact salary figure. This makes it difficult to identify a median from such data.
Nevertheless, we find the data interesting to analyse, as they give a clear picture of how salary ranges are distributed within each grade.
- from "less than 70,000" to 250,000: 71.5% of women and 54.3% of men
- from 251,000 to 600,000: 28.1% of women and 40.6% of men
- more than 600,000: only 0.4% of women and 2.9% of men
- Less than 250,000 roubles is earned by 71% of analysts in Russian companies, 32% of analysts in "partly Russian" companies and 18% of analysts in foreign international companies.
- More than 250,000 roubles is earned by 29% of analysts in Russian companies, 68% of analysts in "partly Russian" companies and 82% of analysts in foreign international companies.
Salaries from NEWHR experts
We decided to publish an additional expert salary assessment because of the limitations of our study's method.
Unfortunately, traditional salary studies do not always provide reliable data for setting a hiring budget or for a candidate to assess their own position on the job market.
- Quantitative surveys require thousands of respondents for each category, grade and specialisation to obtain statistically significant results. In reality such a sample is rarely achieved, especially for highly specialised and highly qualified positions. In addition, respondents often give inaccurate data: some exaggerate their income for the sake of prestige, others understate it out of caution.
- Analysis of job boards suffers from similar distortions: they show expected rather than actual salaries. Moreover, such data do not account for confidential offers, which are often made to highly qualified specialists and executives outside the public eye.
- Industry differences and regional specifics are rarely reflected correctly in standard reports. This leads to averaged data that can differ greatly from the real situation in a particular industry or region.
Expert addition
from Oksana Prutyanova
- head of analyst and data scientist search at NEWHR
- Salary ranges for data and product analysts.
- How much it costs to hire a product or data analyst from a product tech company.
- Which factors raise or lower the cost of analysts.
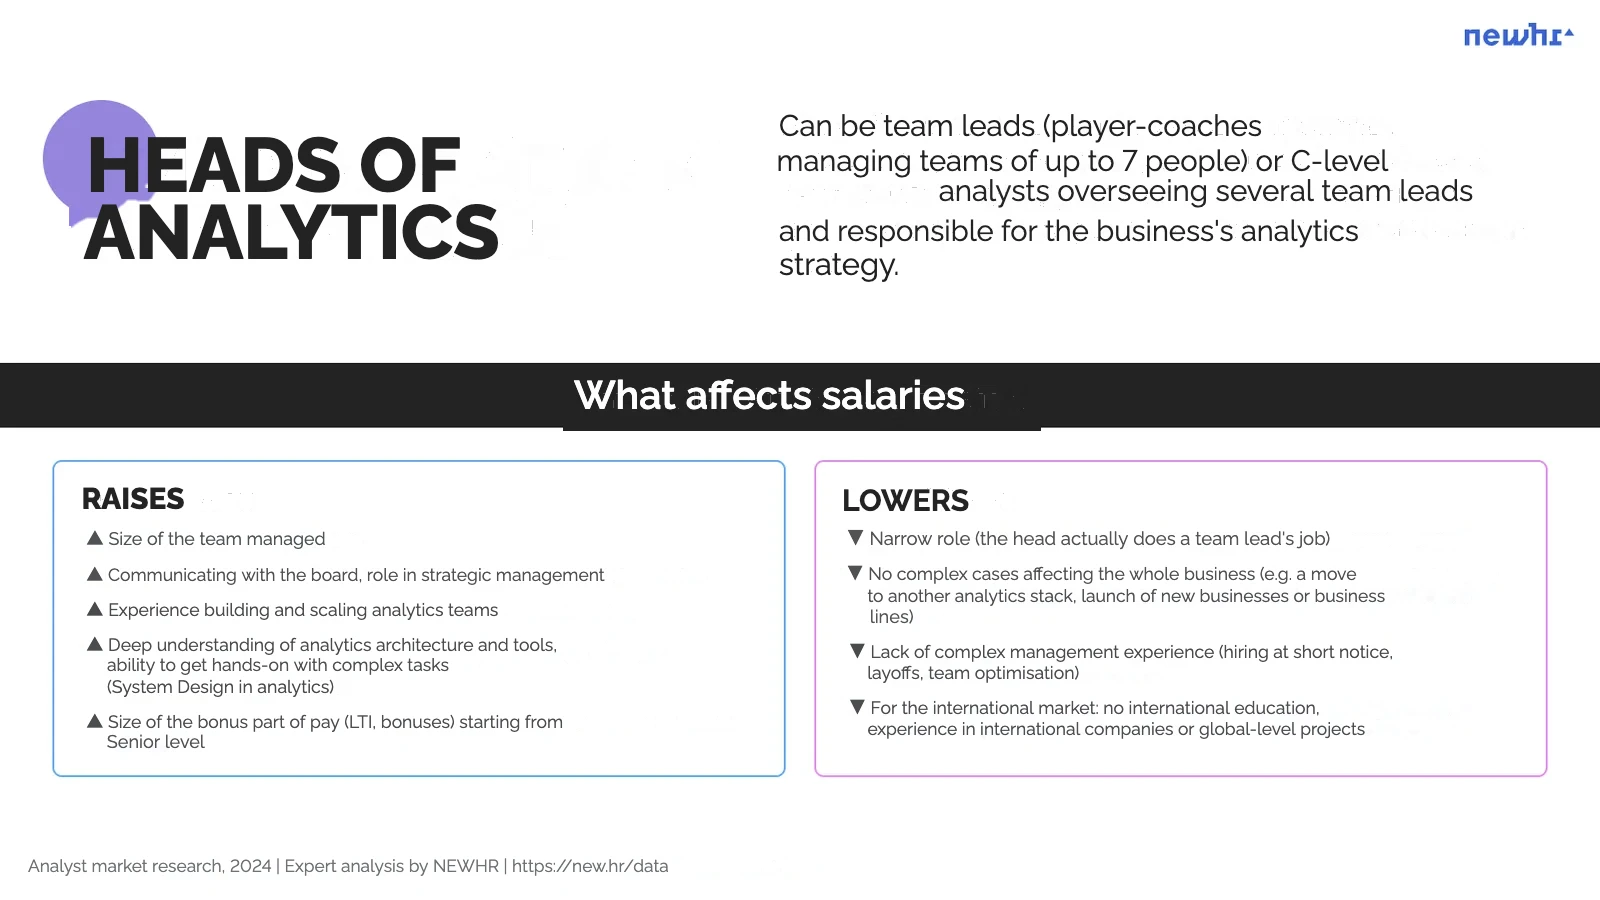
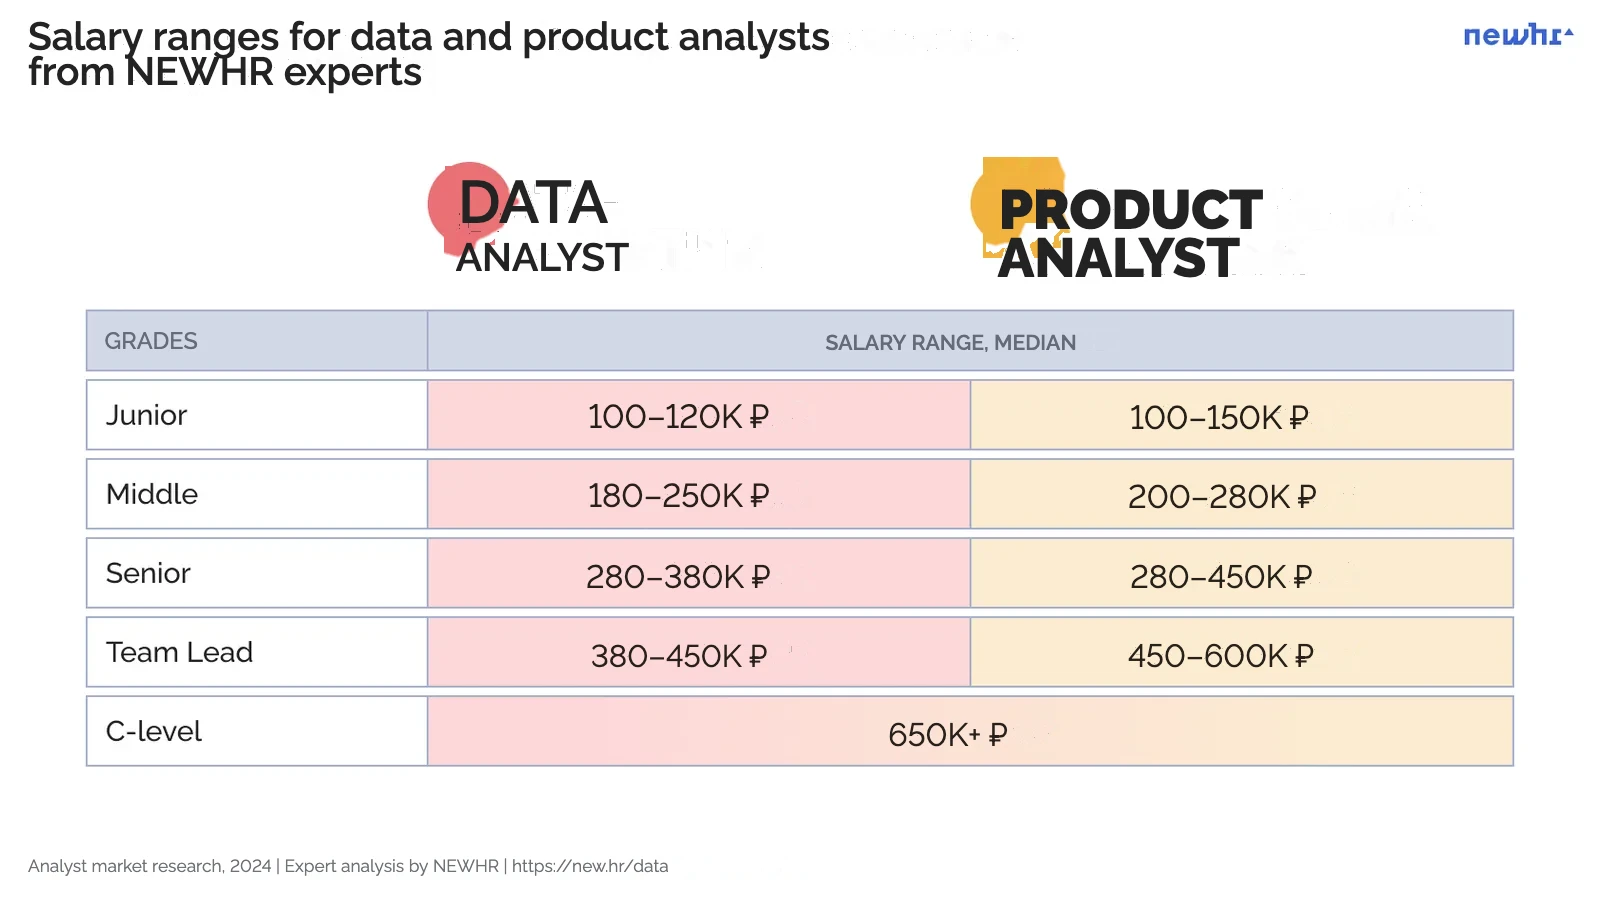
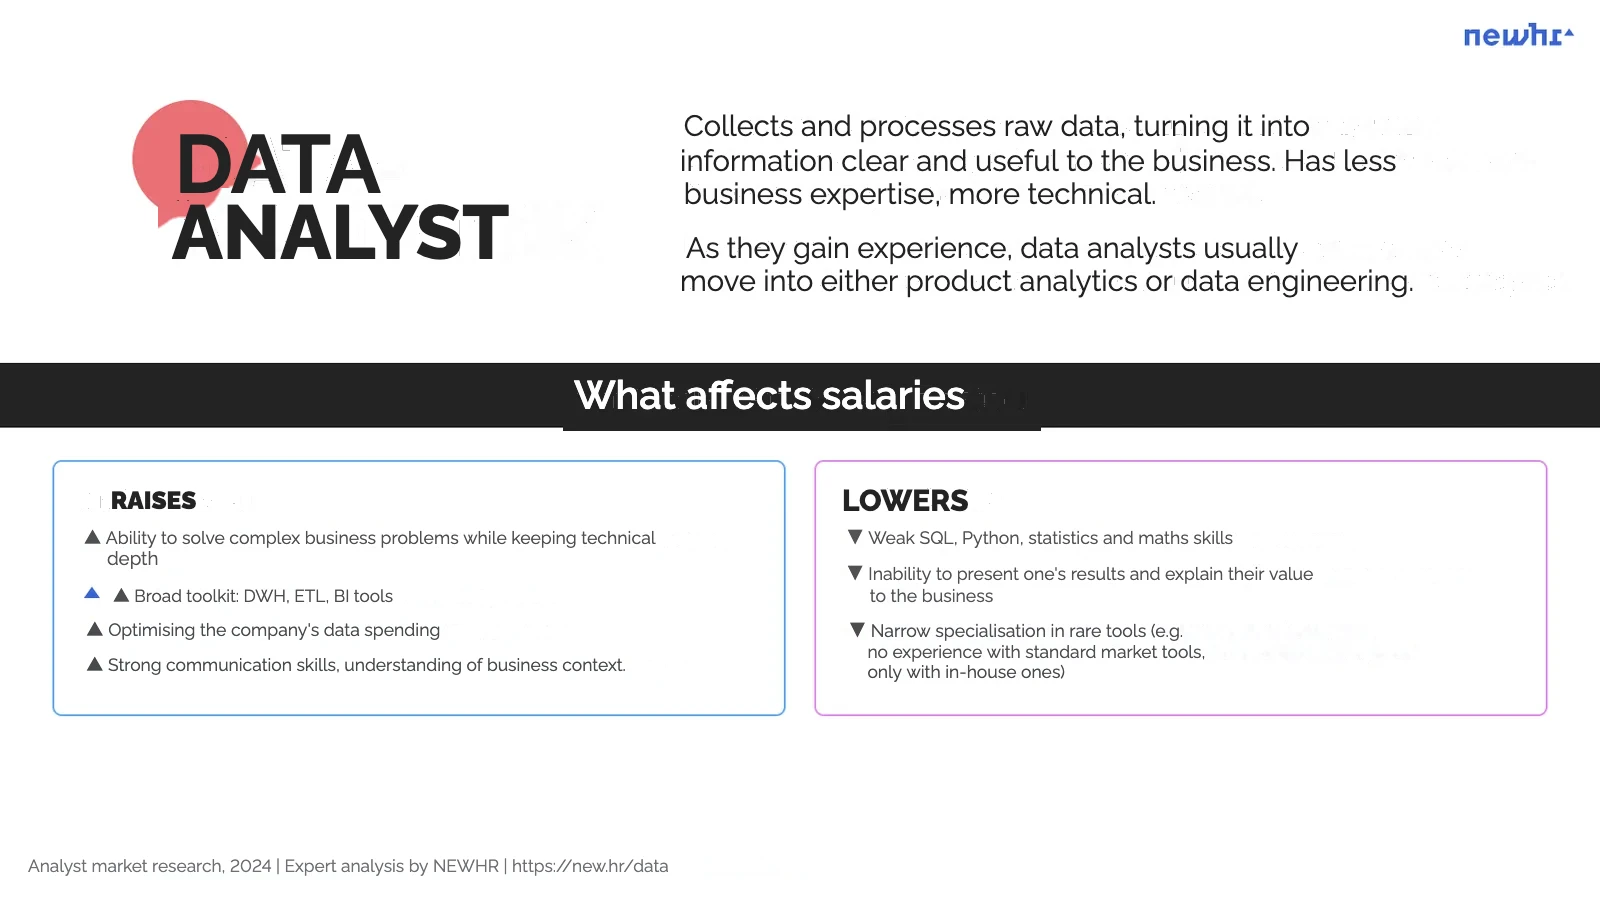
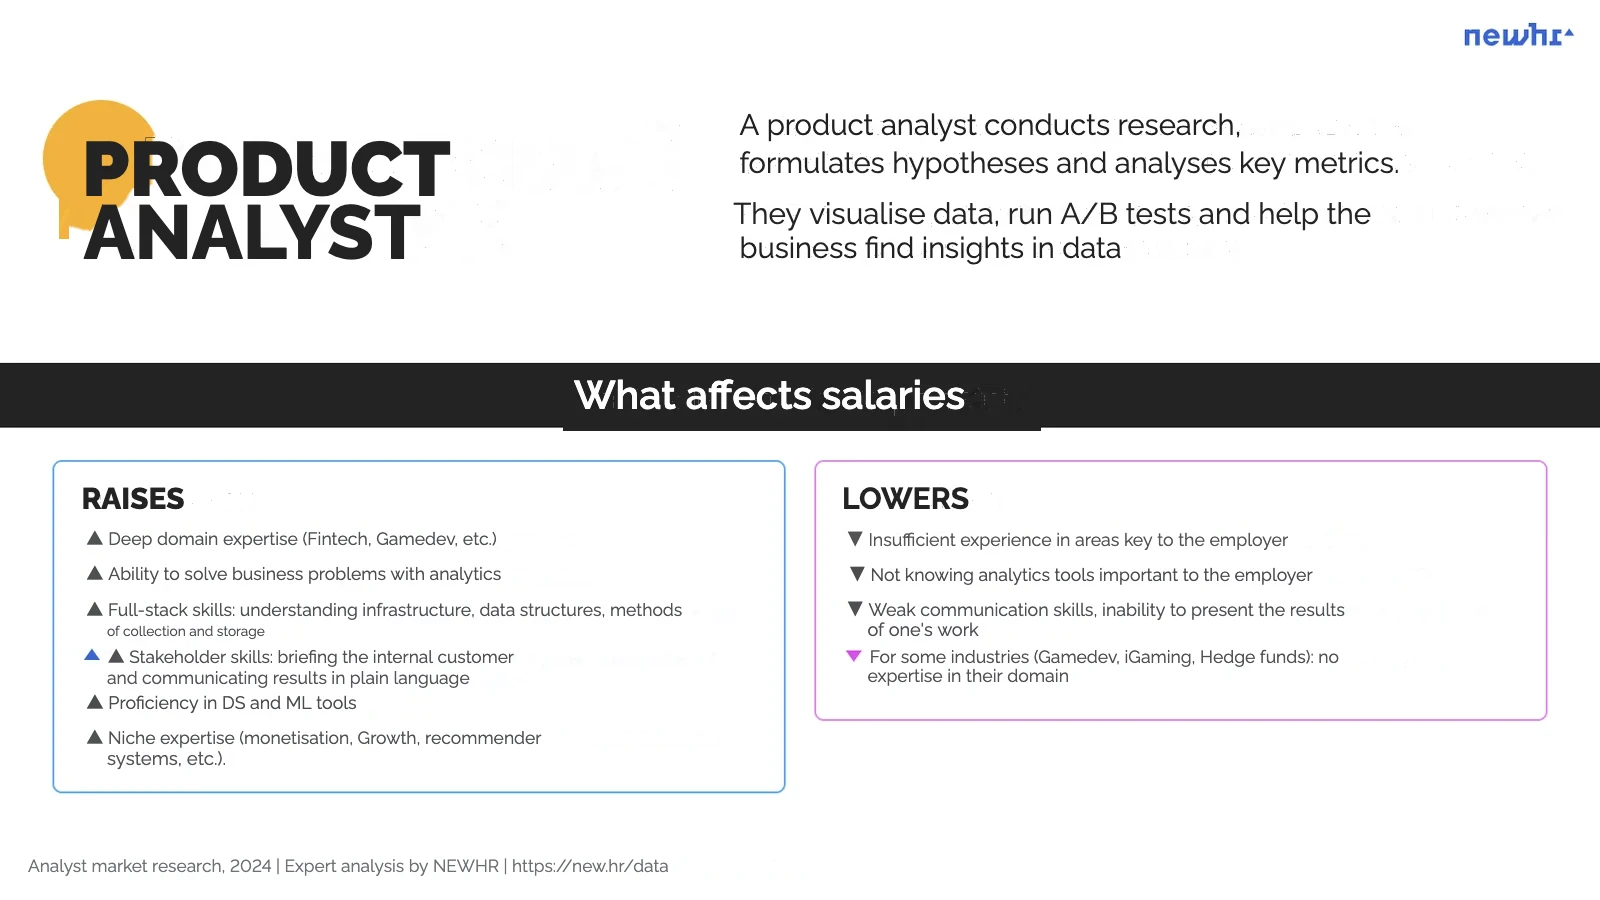
We would like to note separately that in some cases the salaries of seniors and principals can go far beyond any upper limits and exceed the range of the grade itself, while in others they can be at the level of the lead grade. This is related to the expertise of the role and the impact of the tasks being solved on business performance.
100% remote work from any location lowers the cost of hiring analysts for companies, especially on the international market.
The data were obtained by NEWHR experts during 2024 directly from candidates and employers while searching for candidates for vacancies in Russian and international companies.
Career
Question: Have you always worked as an analyst or did you come from another profession?
Number of respondents: 1,293
Half of specialists (51%) come to analytics from other professions, and half (49%) change specialisation within analytics.
Compared with last year, the share of those who came "from outside" is 4.2% higher. The difference is due to the larger representation of interns and juniors in the latest sample. The market situation itself has hardly changed over the year.
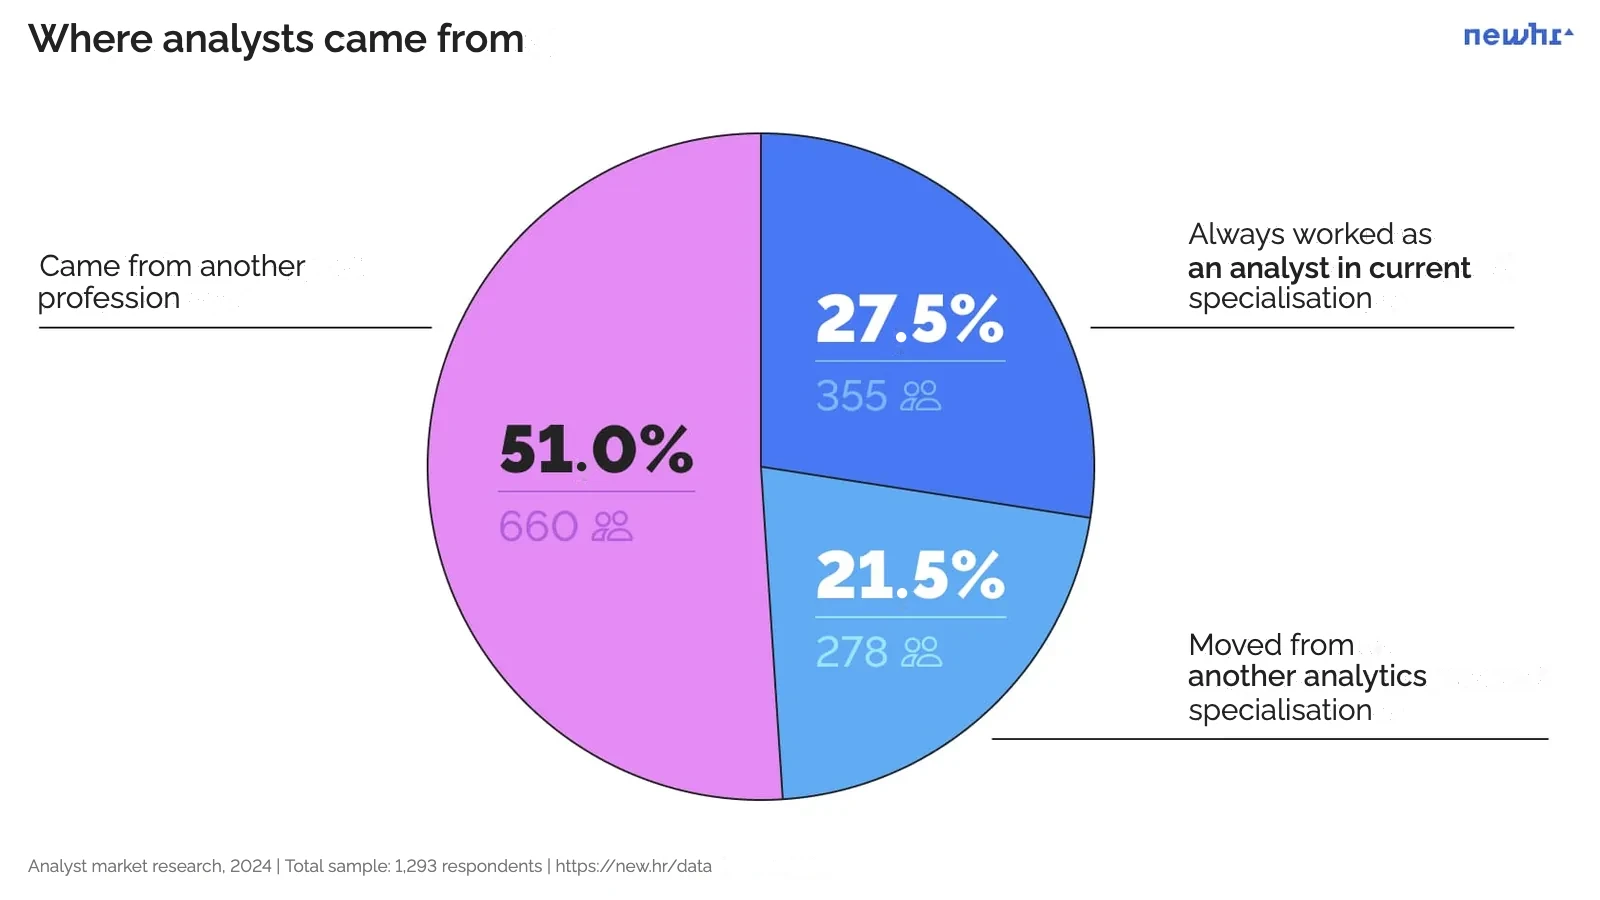
There are most "native" analysts in the senior grades: 58% of seniors, 65% of principals and 64% of team leads have always been in analytics, even if they moved from one specialisation to another. In junior grades the situation is the reverse: "native" analysts make up 32% of interns and juniors combined, while 68% came "from outside".
For different specialisations (except heads) the share of analysts "from outside" ranges from 46.5% to 63%. It is highest among BI analysts (63%), systems and business analysts (54%) and data analysts (54%).
Which specialisations have the most complete-beginner switchers from other professions?
Among the junior grades, 76% of data analysts came "from outside", as did 69% of systems and business analysts and 66% of BI analysts.
So recently (1−3 years) analytics has been actively replenished with people "from outside", which is typical of growing demand for specialists. Bear in mind that people do not necessarily enter analytics as an intern or junior.
In today's reality it seems impossible for a large share of specialists to have more than 6 years of experience, let alone 15 years. Switching is the new normal. First and foremost this is switching from another field, but moving between specialisations within analytics itself is also typical of analysts' professional development.
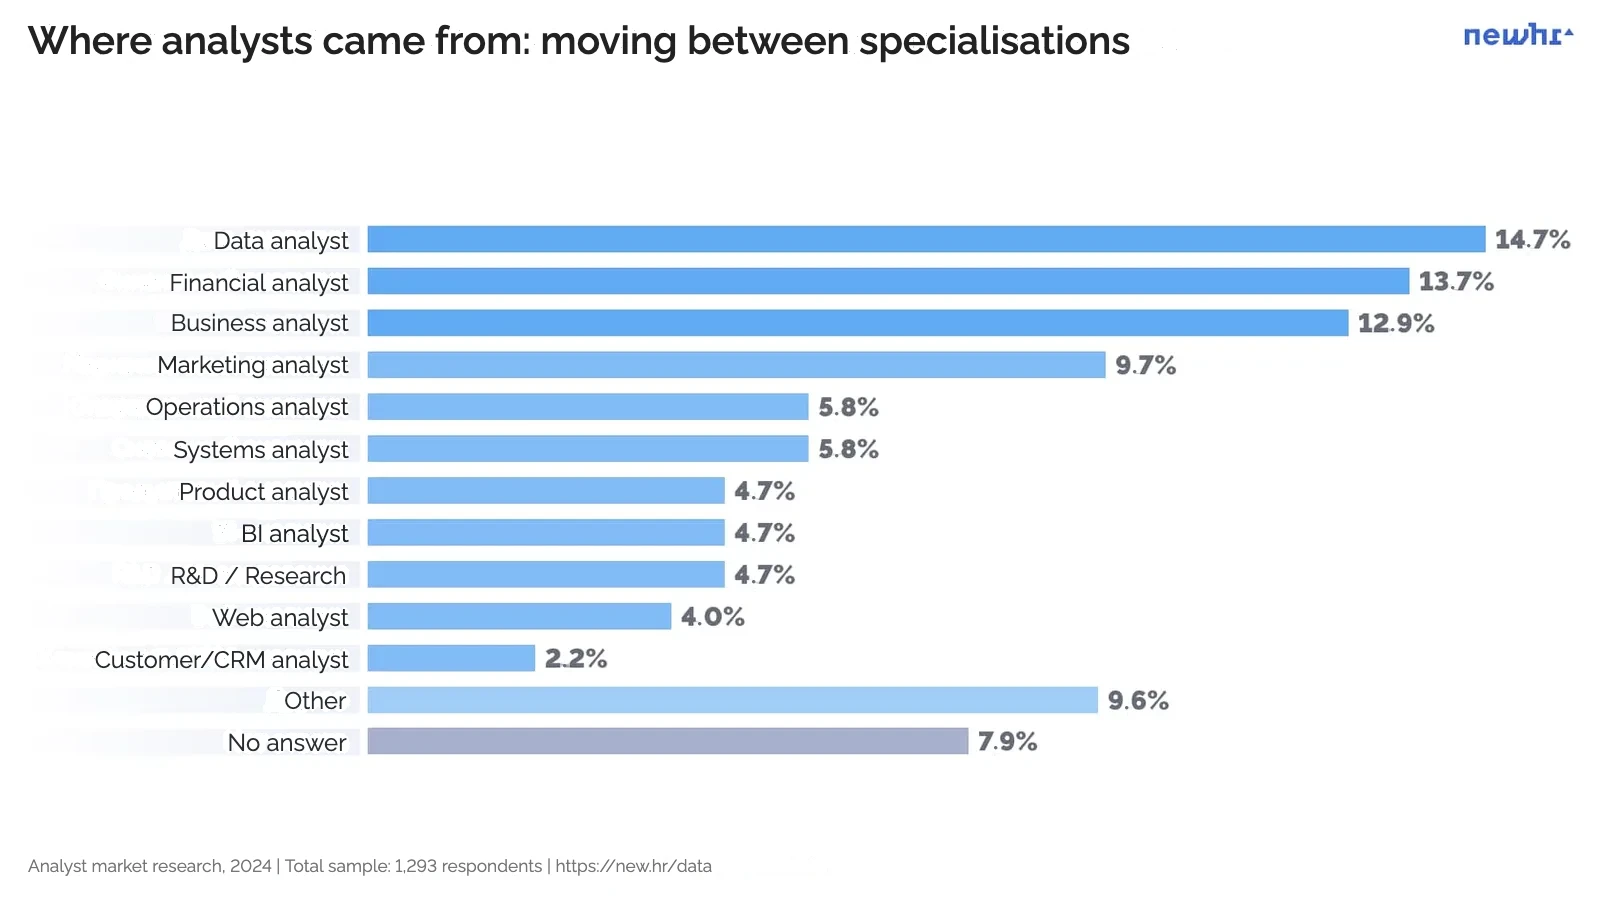
Question: Which analytics specialisation did you move from?
Number of respondents: 278
- Data analyst — 14.7%
- Financial analyst — 13.7%
- Business analyst — 12.9%
Question: Which profession did you come from?
Number of respondents: 660
- an experienced specialist moves from their highly professional field into analytics
- an experienced specialist from a profession with similar skills and tools moves into IT analytics
- a person who has just entered the job market with initial work experience chooses analytics as a profession
- other options
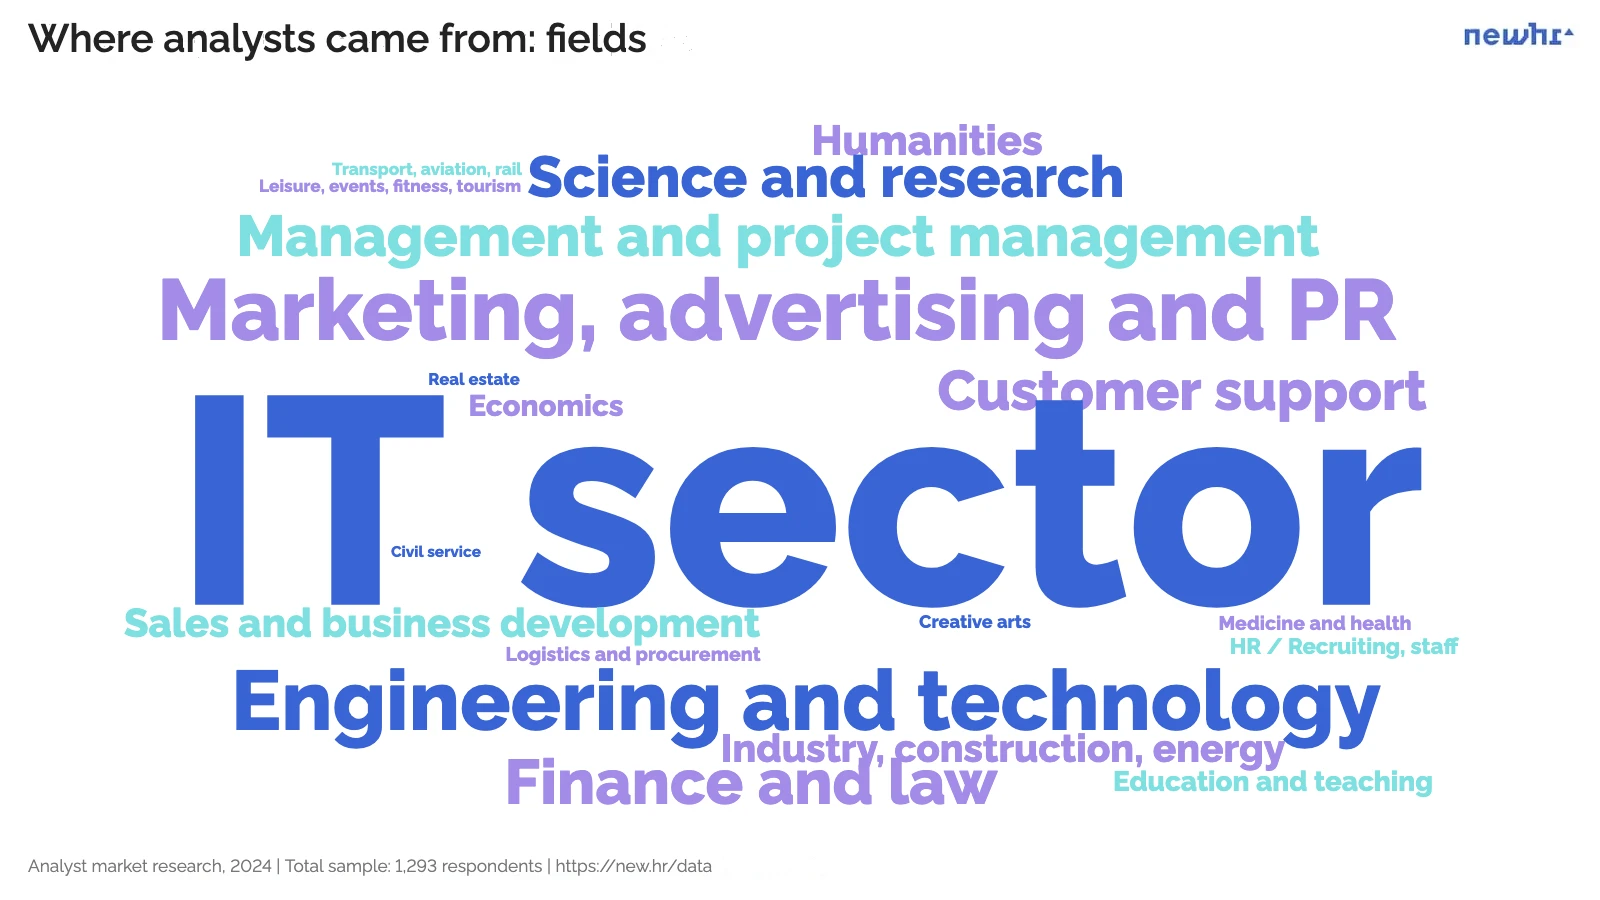
There are unique cases of moving into analytics both from highly specialised professions and from ones that require no qualifications.
These are exceptions; no influx of switchers should be expected from here: bookseller, land surveyor, archaeologist, special-needs educator, police detective, polygraph examiner, tax inspector, boiler room operator, general labourer.
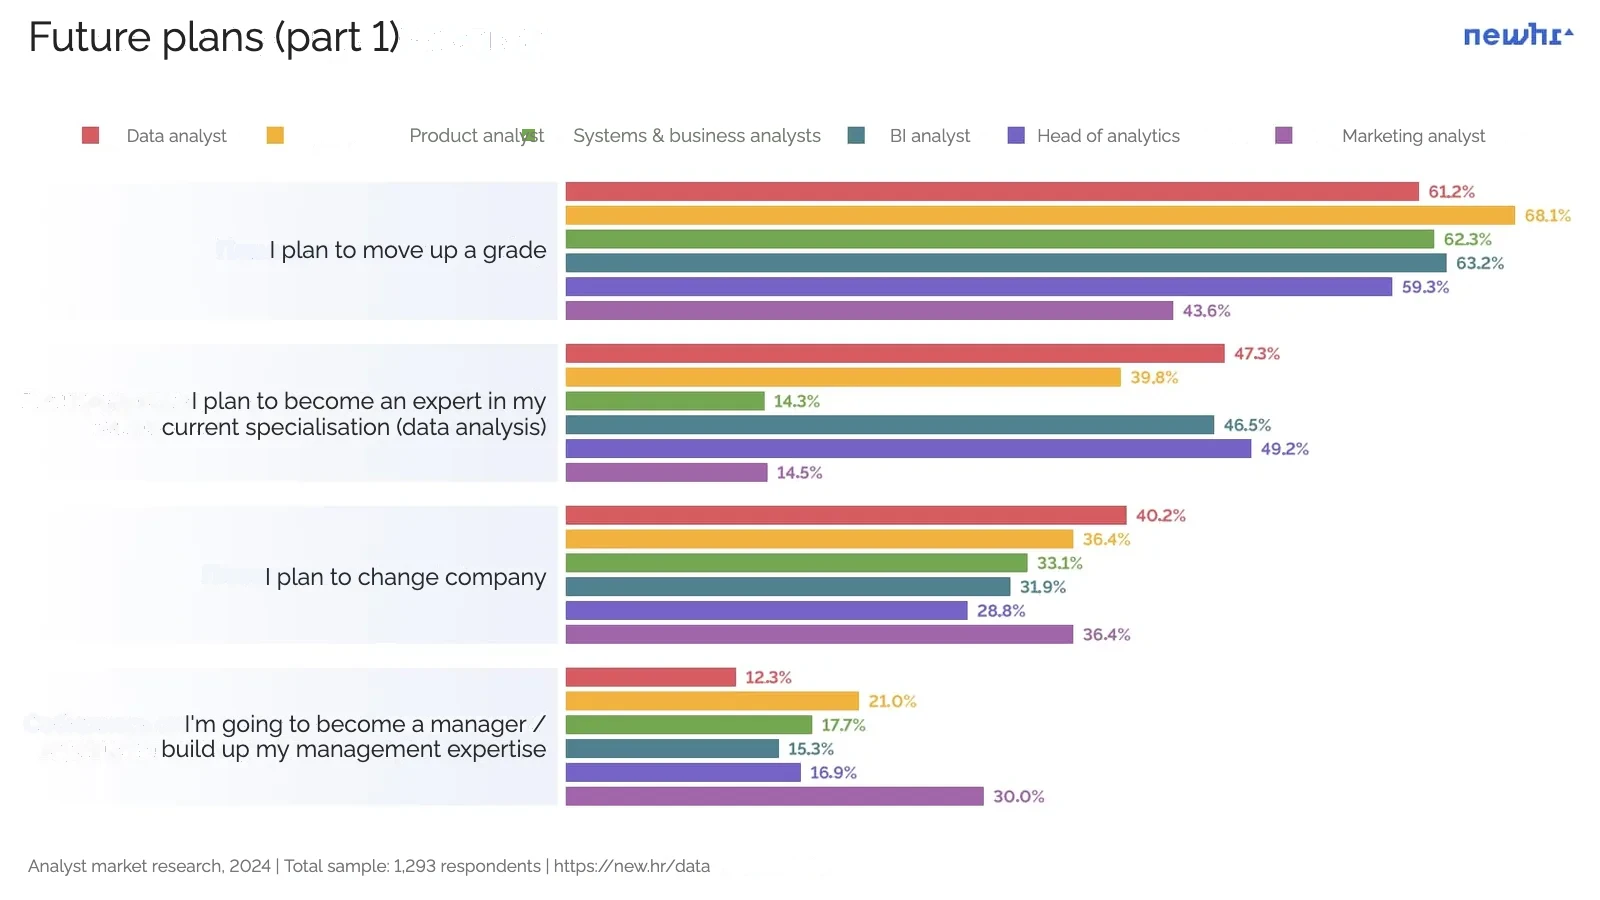
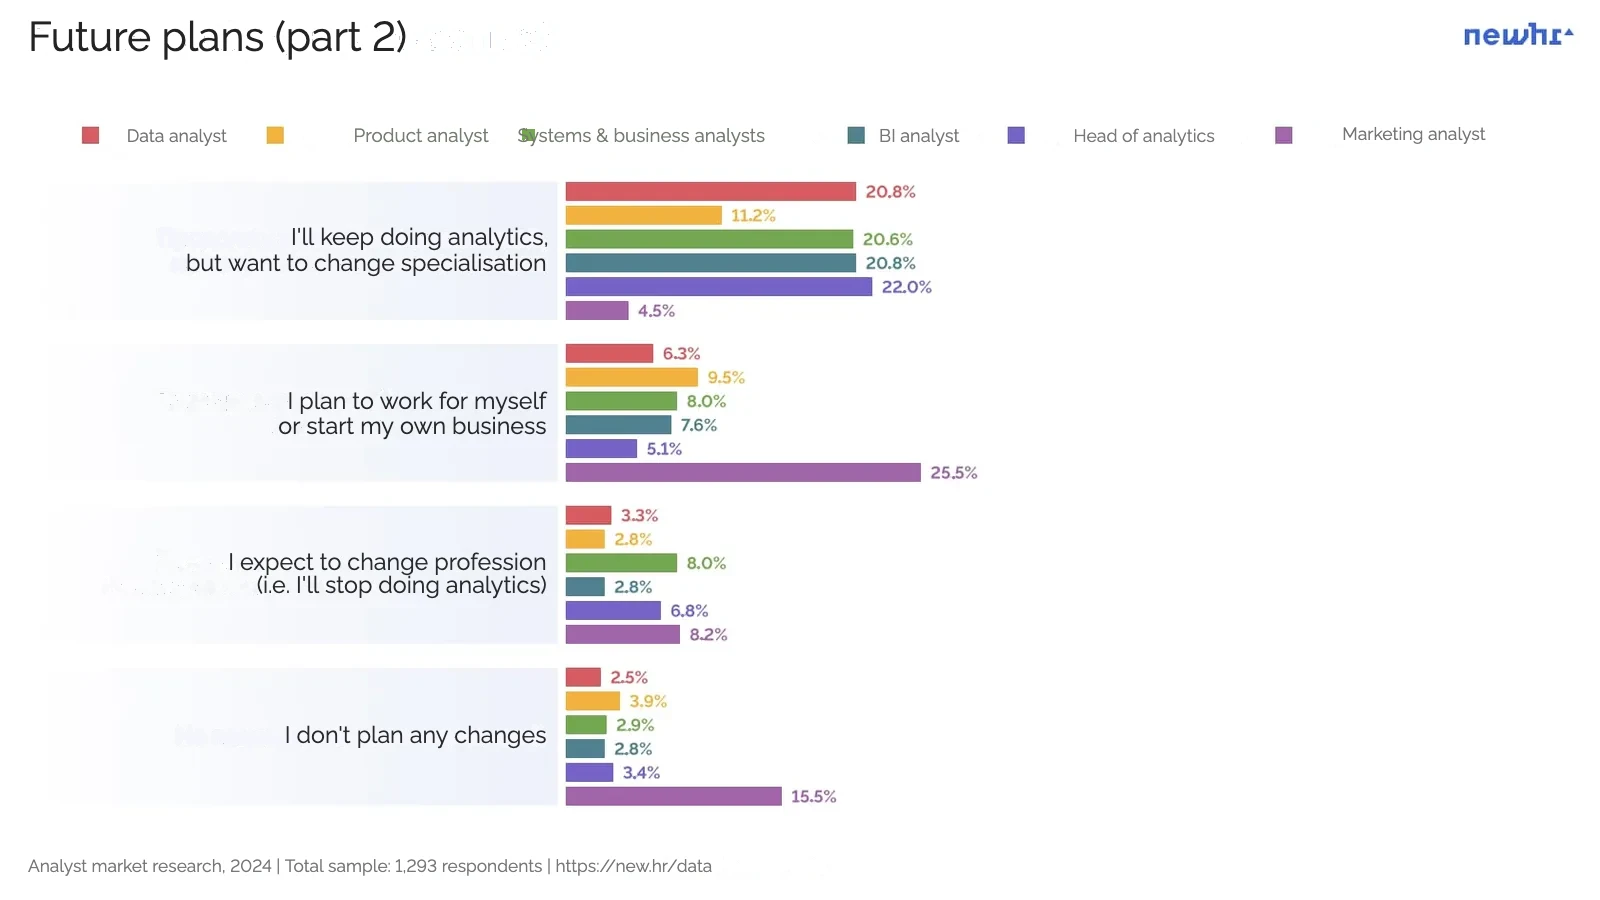
Question: What changes in your career and professional activity are you planning in the next 1.5−2 years?
Number of respondents: 1,293
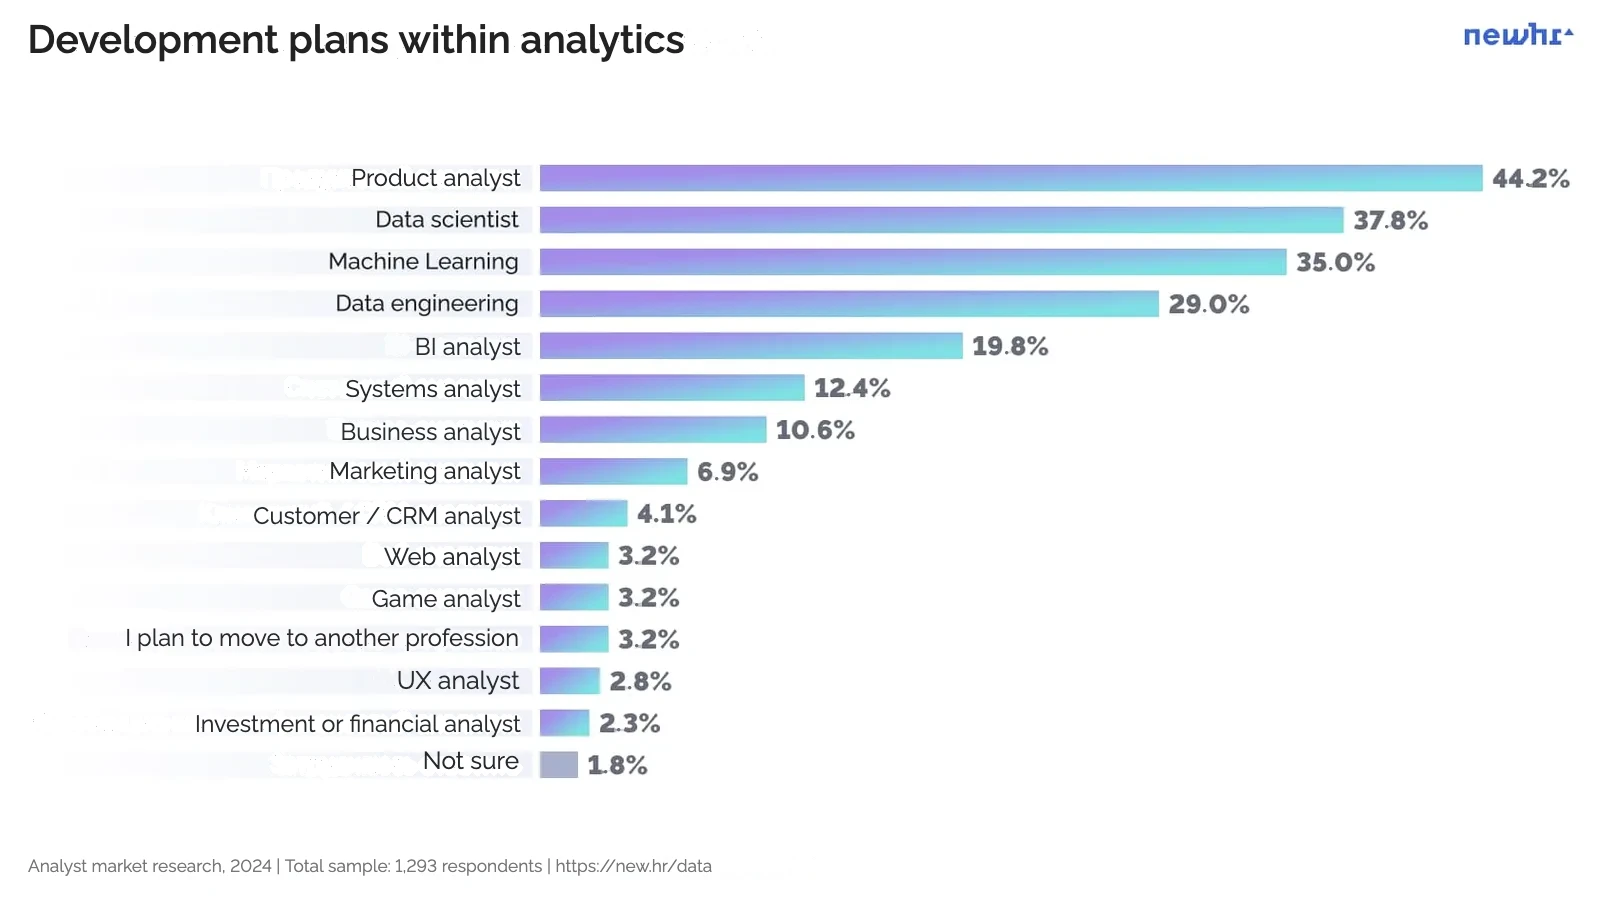
Respondents are loyal to their profession: on average only 3% want to change it. Most want to develop within analytics: move up a grade, become an expert, change employer and so on.
Product analysts more often plan to become managers, and data analysts to change specialisation within analytics.
Question: How do you plan to develop within analytics?
Number of respondents: 217
- Product analyst 44.2%
- Data Scientist 37.8%
- Machine Learning 35.0%
- Data Engineering 29.0%
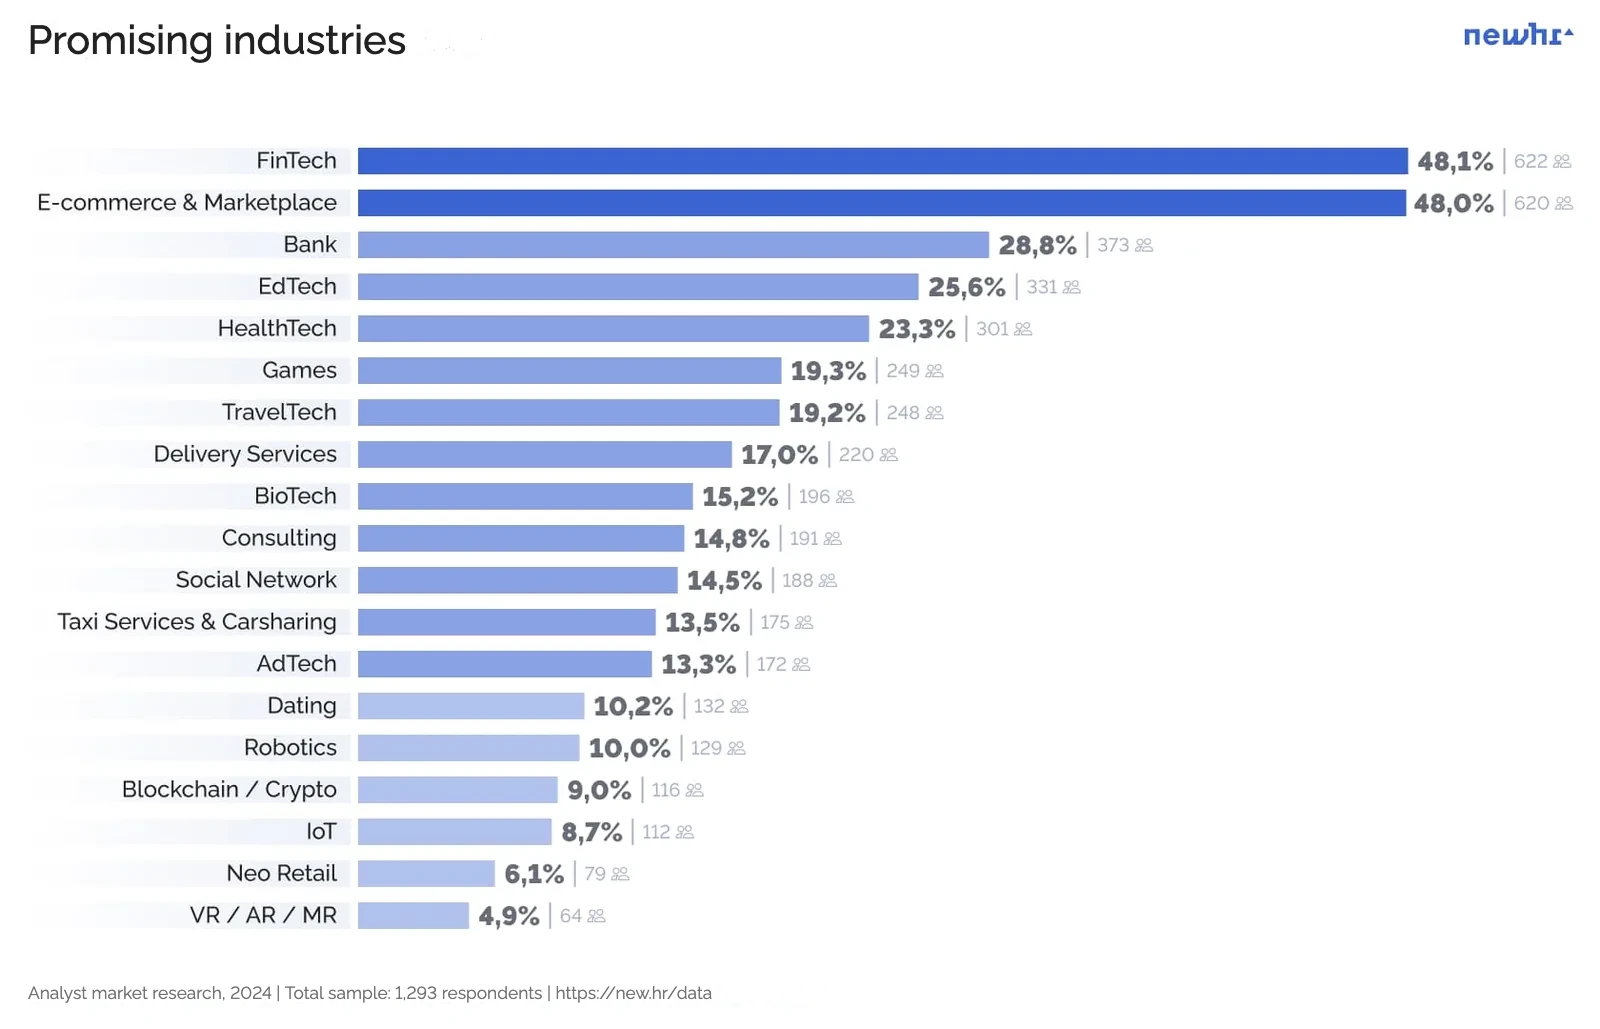
Question: Which industries do you consider most promising for your professional development?
Number of respondents: 1,293
As before, analysts are interested in a wide variety of industries.
The absolute leaders in attractiveness for analysts are fintech (48%) and marketplaces (48%).
EdTech has held high positions for the second year running (it took third place in 2023).
Games are going down: 28% in 2023 and 19% in 2024 (now).
Oksana Prutyanova
Head of analyst
and data scientist search at NEWHR
"In fintech, candidates are attracted by the pace of the industry's development and salary dynamics, and the absence of bureaucracy compared with 'classic' banks. E-commerce and marketplaces are also developing dynamically and have a number of large players. These companies maintain the 'cosy' atmosphere of big tech and a developed product culture, understand the value of analytics and know how to use it, which makes their HR brand more attractive in analysts' eyes and fuels interest in this industry."
Job search
From interview to offer
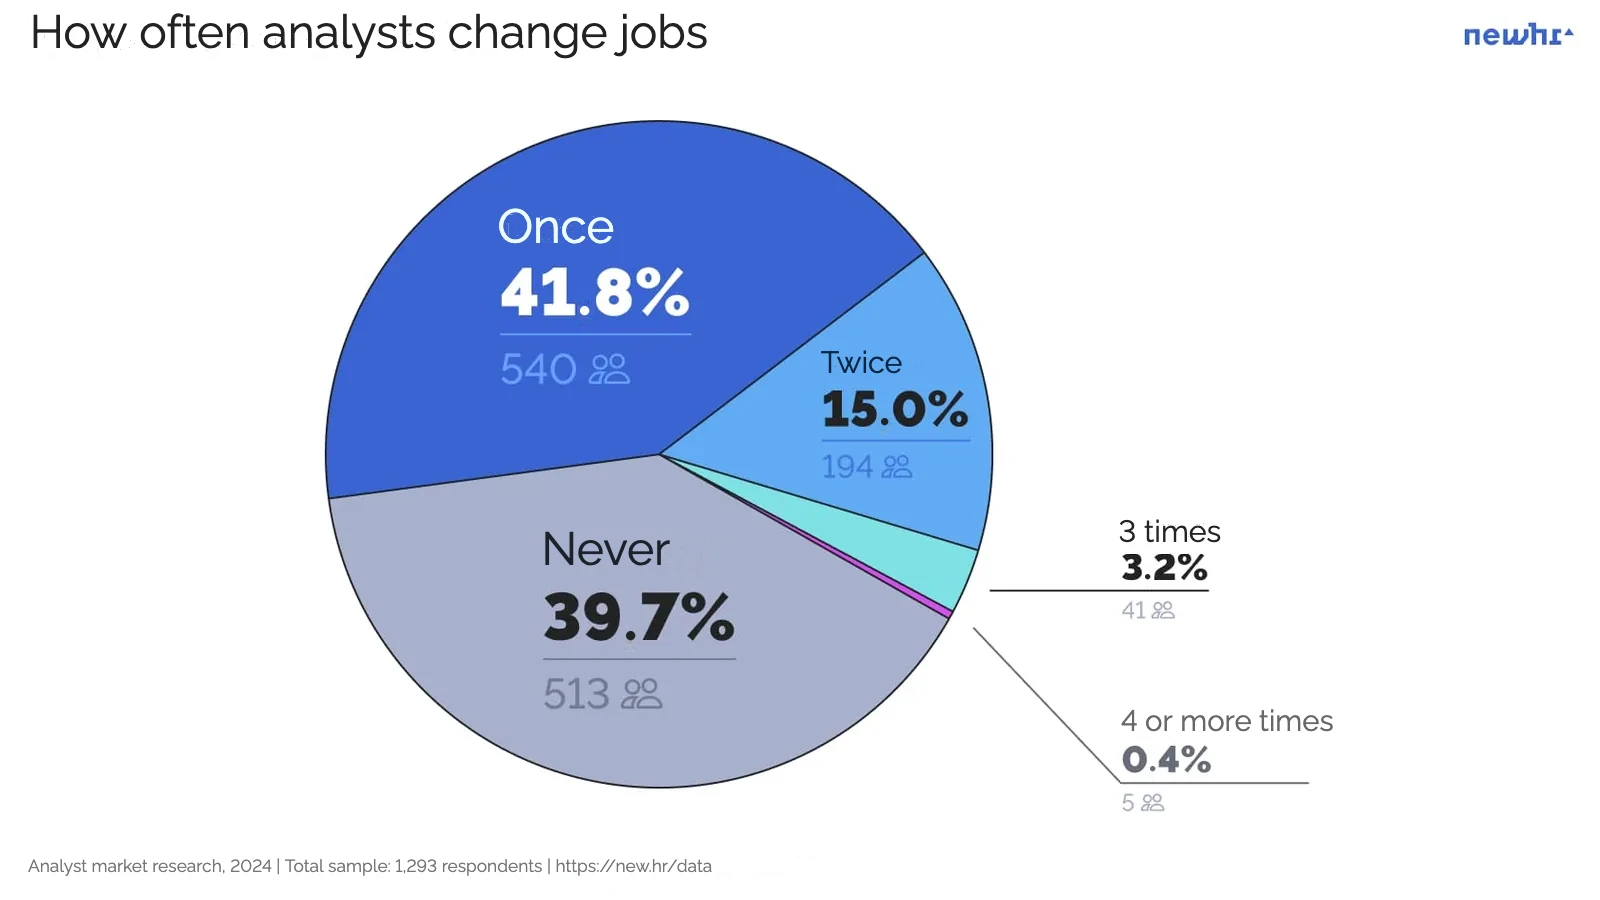
Question: How many times have you changed jobs in the last 2 years?
Number of respondents: 1,293
60% (780 people) of respondents changed jobs at least once in the last two years (61% in 2023).
Of this group, a third managed to do so 2 or more times (240 people, 31% of those who changed). But the norm is rather a single job change: 69% of those who changed did so once in 2 years.
There is no change compared with last year, and there are no sharp changes on the market, at least none that would show up over a two-year retrospective.
Differences by specialisation:
Product analysts (63%) and data analysts (62.5%) changed employers most often. They also changed more employers: they have the highest rates of changing two employers.
Heads changed jobs less often: 48% changed company in 2 years.
Oksana Prutyanova
Head of analyst
and data scientist search at NEWHR
"In a healthy market, the higher an analyst's grade, the less often they change employers (compared with juniors and middles), because high-grade specialists work on more complex tasks and projects that take longer to deliver. They need to 'accumulate' achievements before going back to the market. This approach is typical of building a career deliberately and does not account for force majeure factors (layoffs, redundancies, company liquidation, etc.)"
Question: Where do you find the most interesting analytics vacancies?
Number of respondents: 1,293
Stated their location: 1,265
- The top 5 vacancy sources for all analysts are:
- HeadHunter — 56.7%
- Telegram channels — 43.5%
- LinkedIn — 32.7%
- Recruiters find me themselves — 32.2%
- Personal connections, networking — 28.5%
LinkedIn has seriously lost importance for analysts, by 13%. It has almost been overtaken by recruiters who personally approach the candidate.
Alena Makarova
Head of research
at NEWHR
"Comparing these results with others in our study, we see a gradual decline in interest in the foreign market among specialists who live in Russia and work for Russian companies. By the end of 2024 our respondents had started to focus more on the market that is closer to them: in Russia, on the Russian market; abroad, on the foreign market. And they choose the resources that are relevant to them."
In Russia the main source of vacancies is HeadHunter (67%); in the near abroad, LinkedIn (60%) and HeadHunter (51%); in the far abroad, LinkedIn (68%).
Top 5 vacancy sources
Number of respondents: 1,265
- HeadHunter — 67%
- Telegram channels — 45%
- Recruiters find me themselves — 33%
- Personal connections, networking — 28%
- Linkedin — 19%
- Linkedin — 60%
- HeadHunter — 51%
- Telegram channels — 47%
- Recruiters find me themselves — 33%
- Personal connections, networking — 25%
- Linkedin — 68%
- Telegram channels — 38%
- Personal connections, networking — 34%
- Recruiters find me themselves — 29%
- HeadHunter — 25%
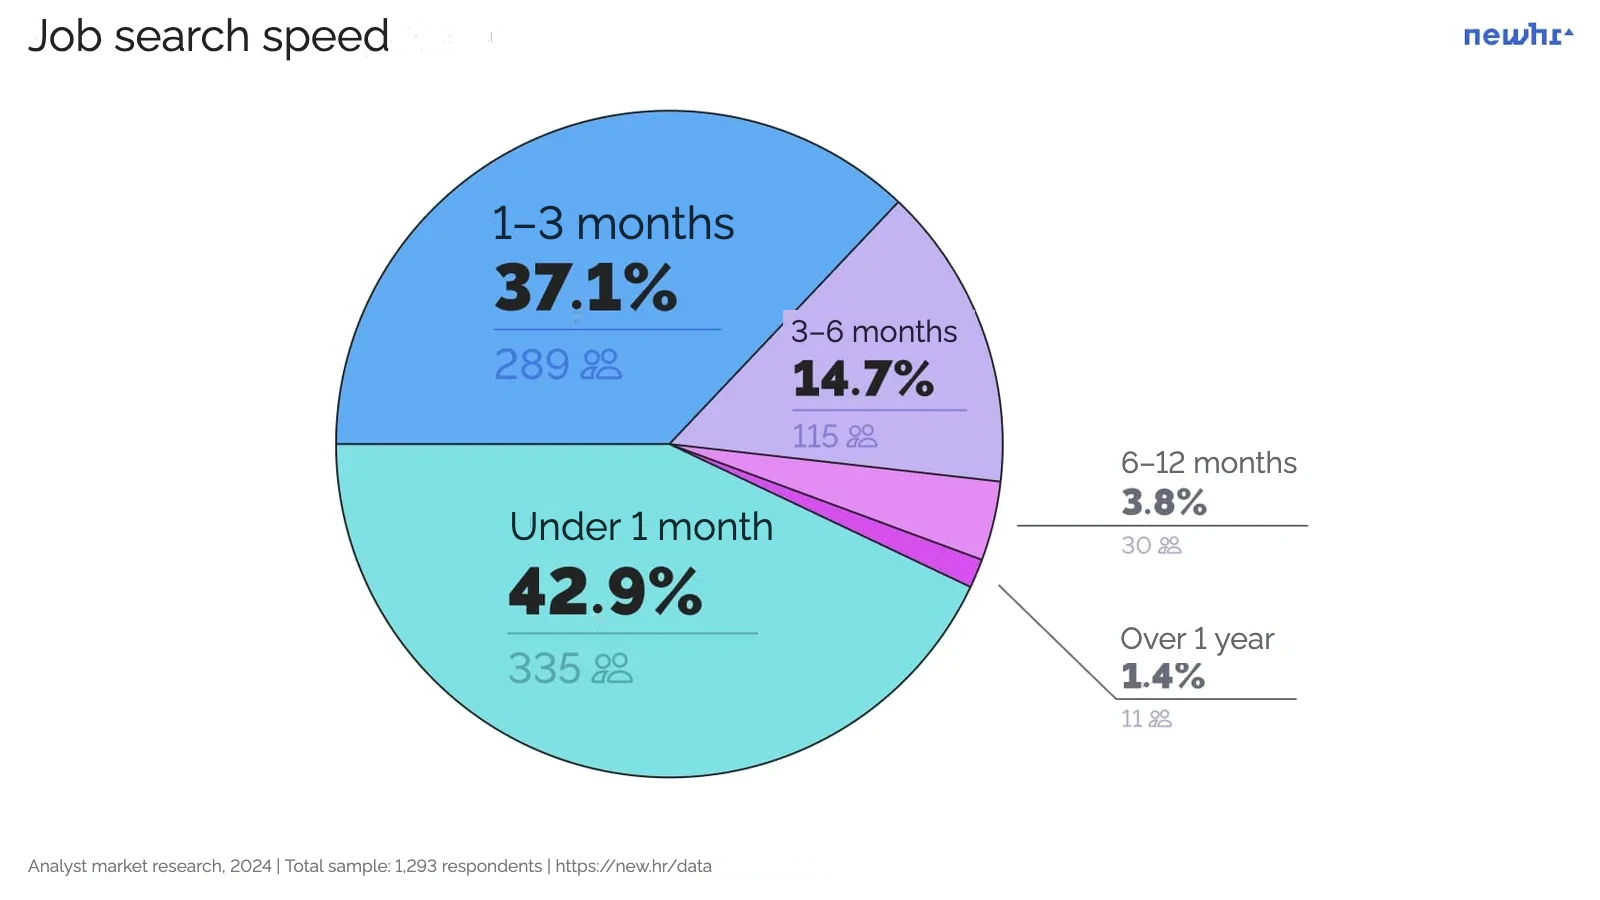
Question: How long did your last job search take?
Number of respondents: 780
Over the last 2 years the overwhelming majority of analysts, 80%, found a job within 3 months, and slightly less than half of them within 1 month at all.
Bear in mind that respondents have no clear criterion of what "search time" means. People most often perceive it as the period of very active searching. A specialist may be searching in the background while working for their current employer, and count the time from the start of active communication with recruiters about target vacancies.
Search time is also clearly linked to the type of company the analyst joins (see the chart).
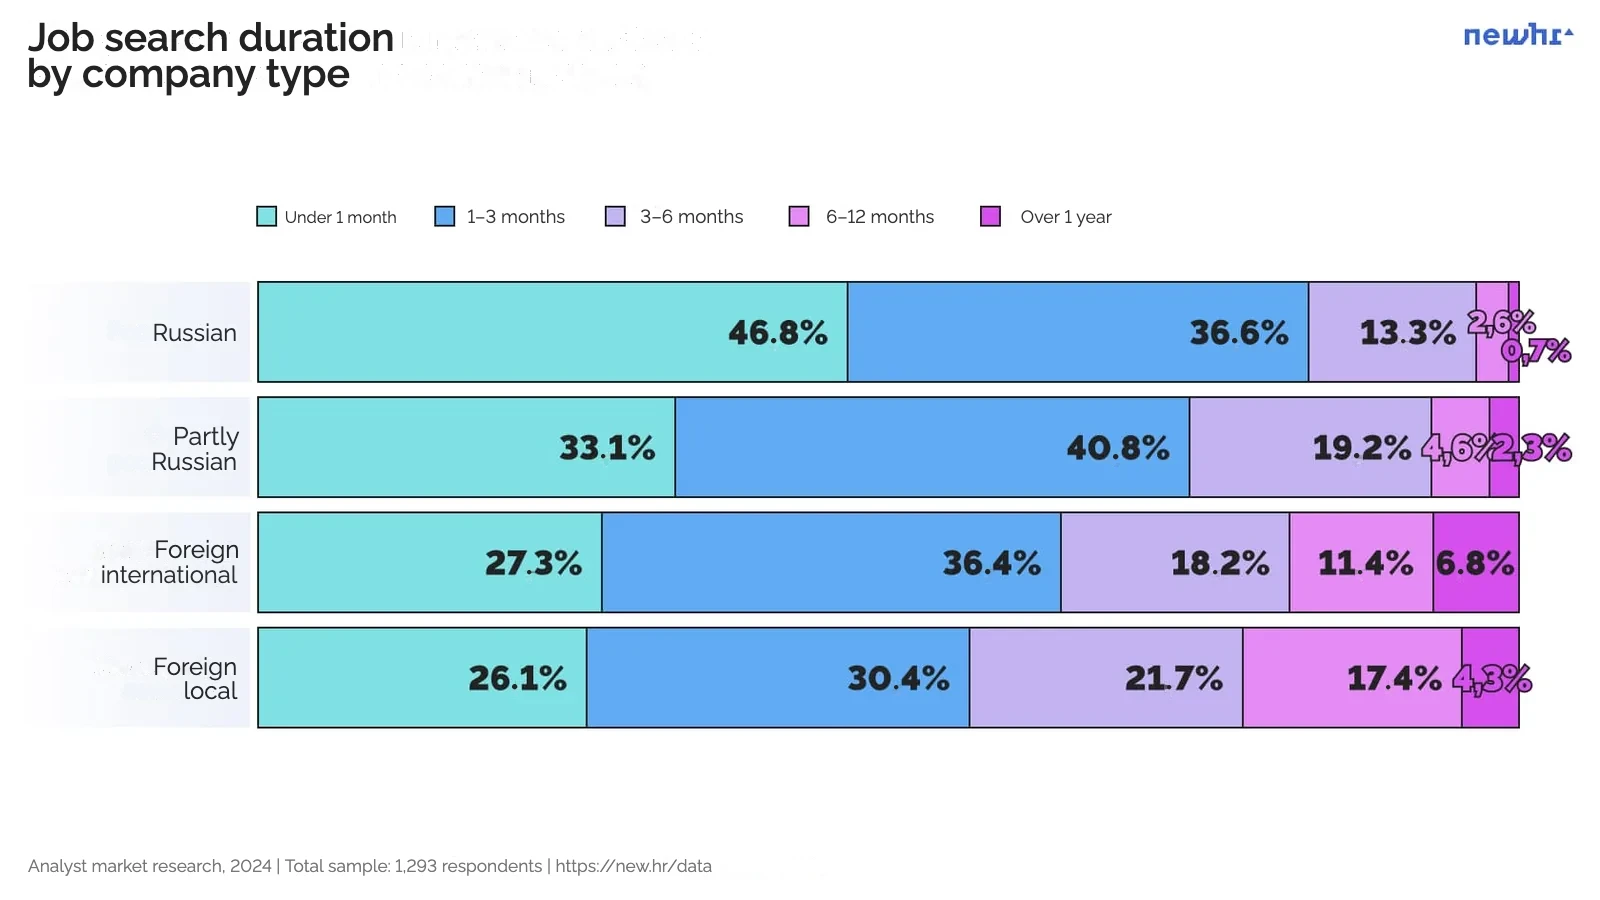
- Grade is linked to job search time: half of seniors (53%), principals (55%) and team leads (51%) found a job within 1 month. The search was slower for heads of analytics, juniors and CDOs/CAOs. Nevertheless, the overwhelming majority of all grades found an employer within six months. The search took longer for 2% of team leads, 4% of seniors, 5% of principals, and 6% of juniors, middles and heads of analytics.
- Specialisations are also somewhat linked to job search. Data analysts (84%) and heads of analytics (83%) most often fit within 3 months. Marketing analysts (73%) and systems and business analysts (75%) do so least often.
- Respondents' gender: women tend to move to a new job faster than men, who stretch out their search more. 48% of women and 39% of men found a job within 1 month. And 17% of women and 23% of men started within 3 months.
Alena Makarova
Head of research
at NEWHR
"Perhaps this is linked to the fact that women much more often find themselves without work and salary, as we have already noted. The pay gap to women's disadvantage is probably also partly linked to the fact that women are less picky when choosing an employer."
Question: Name the companies where you had interviews
Number of respondents: 297
- 15 leading companies by interviews
- Yandex — 25.6% | 76 people
- T-Bank1 — 20.9% | 62
- Sber2 — 15.2% | 45
- Avito — 13.8% | 41
- Ozon — 10.1% | 30
- Wildberries — 9.8% | 29
- VK3 — 8.8% | 26
- MTS Digital — 8.8% | 26
- Alfa-Bank — 7.1% | 21
- Cian — 6.1% | 18
- Magnit — 5.7% | 17
- X5 Group — 5.4% | 16
- Samokat — 5.1% | 15
- InDrive — 4.7% | 14
- HeadHunter — 4.4% | 13
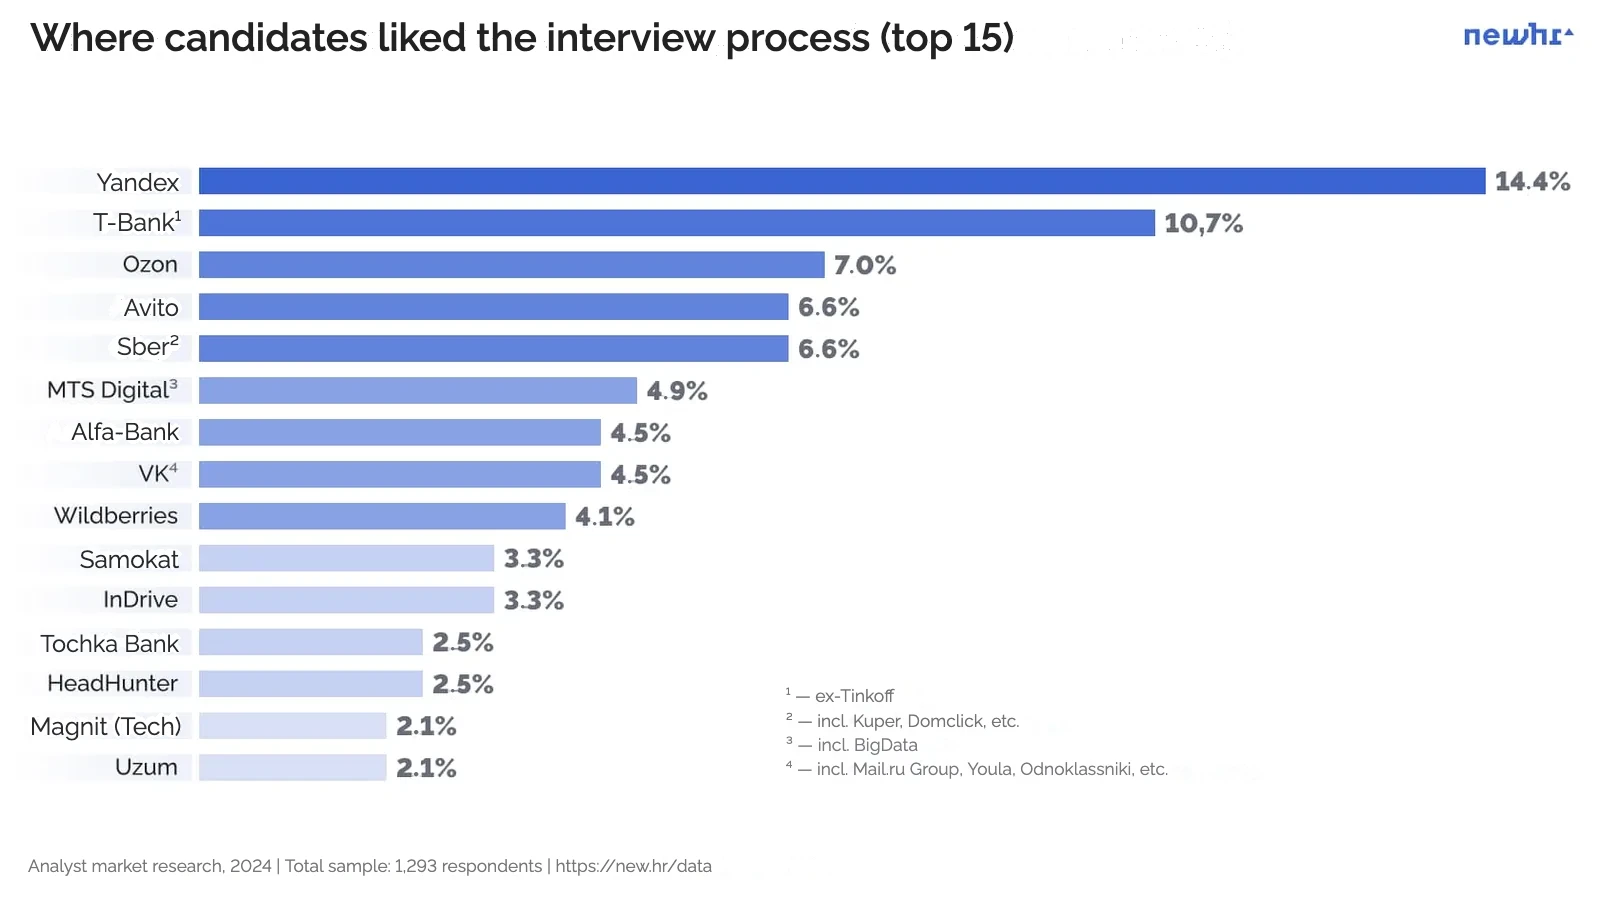
Question: In which companies did you like the interview process?
Went to interviews: 749
Answered: 243
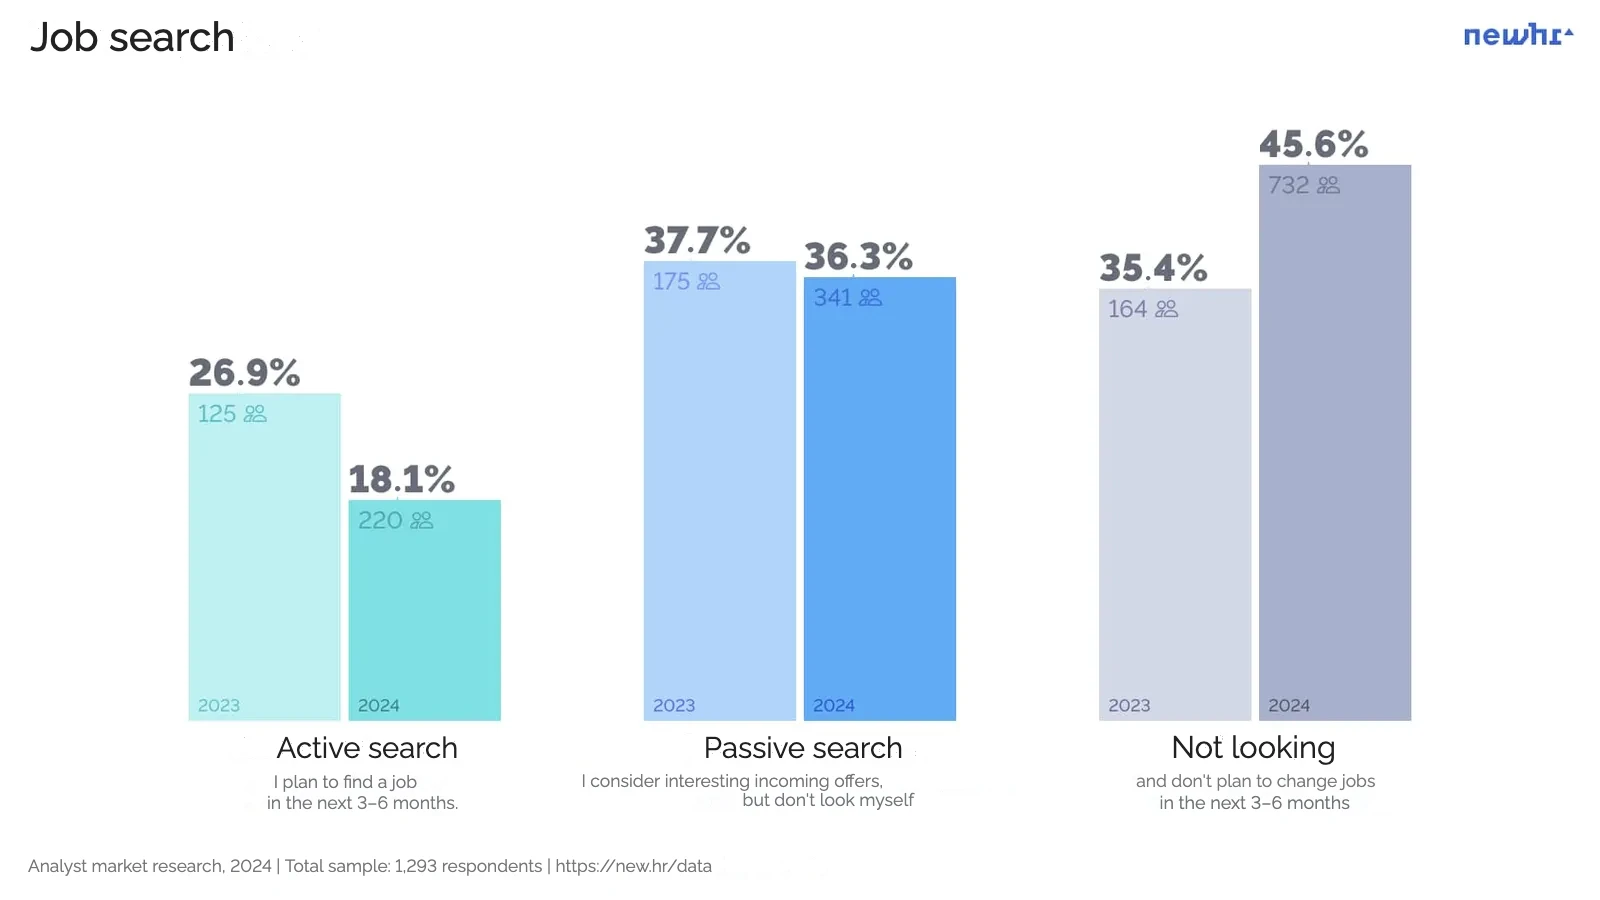
Question: Are you considering a job change right now?
Number of respondents: 1,293
In 2024 analysts are less interested in looking for a job than they were at the end of 2023. The share of active job seekers has fallen: while at the end of 2023 roughly every fourth respondent was looking, at the end of 2024 it was every fifth. Analysts are much more loyal to their current job (46%) than a year ago (35%).
Whether this is a trend we will see in a year.
- 75% of active job seekers
- 60% of those in "passive search"
- 52% of those who are "not looking and not planning to change jobs" in the next six months
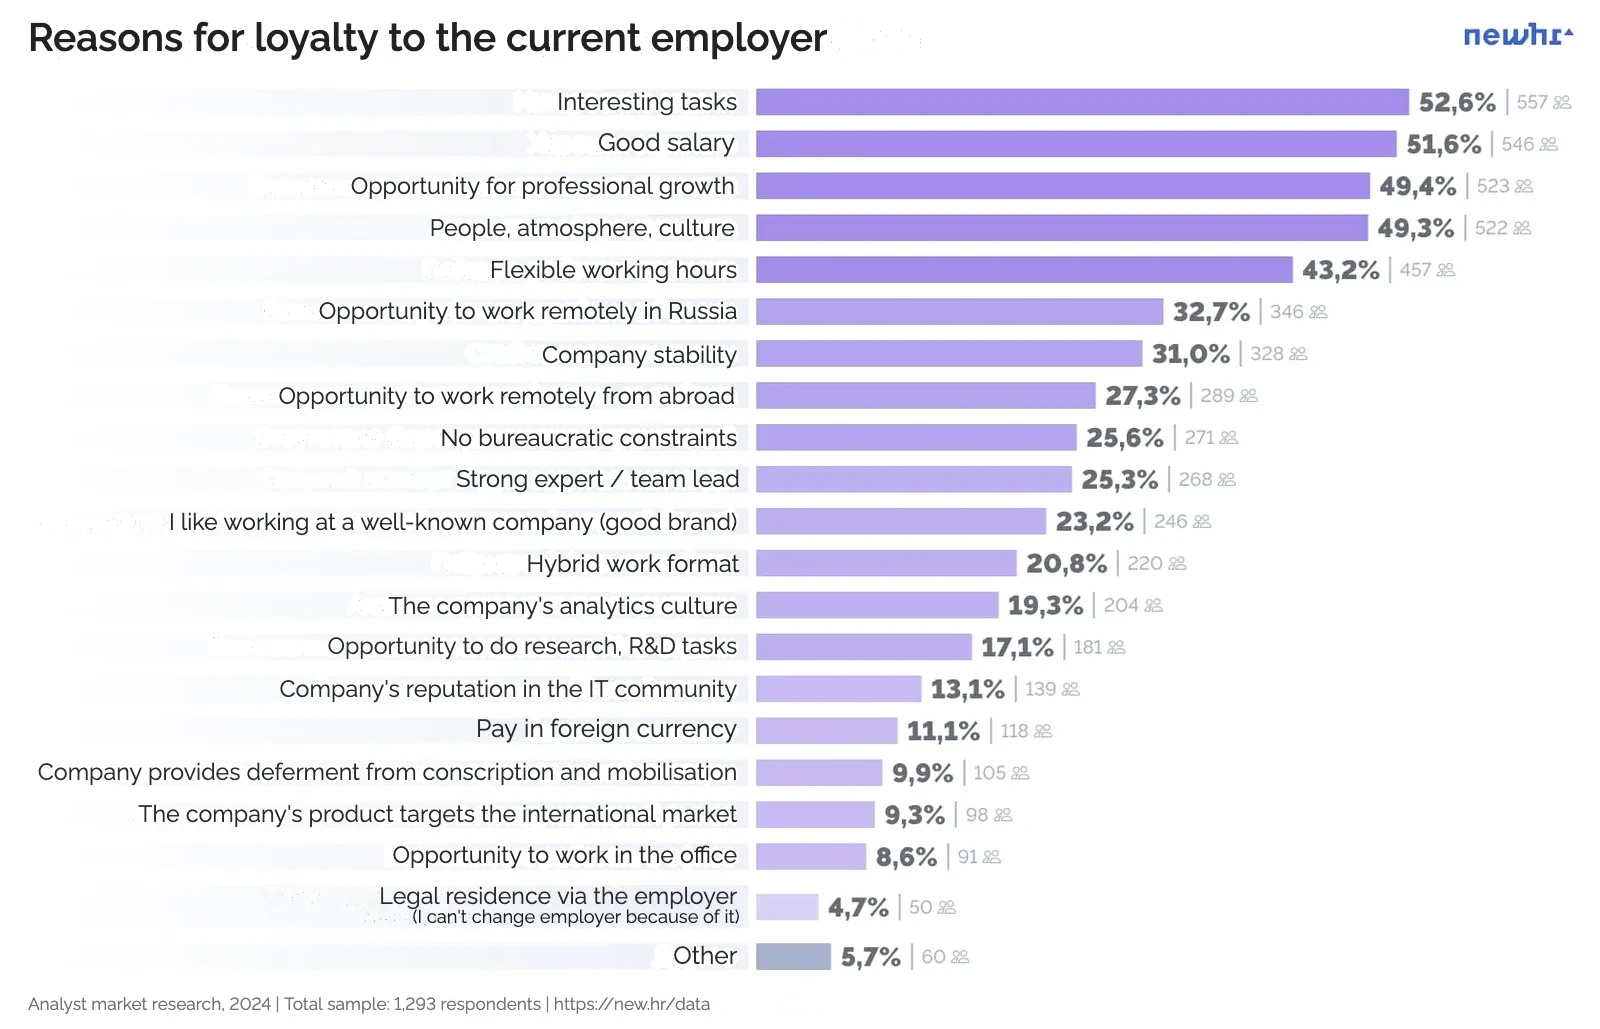
Question: What keeps you at your current job?
*Number of respondents: 1,059
Multiple choice*
Analysts are kept at their current job by interesting tasks, a good salary, opportunities for professional growth, a familiar team and a comfortable work format.
In 2024 a good salary became one of the decisive factors in retaining analysts. The importance of a good salary rose sharply compared with last year, doubling from 25% to 51.6%. It has become extremely important for half of the analysts who stay with their company.
Oksana Prutyanova
Head of analyst
and data scientist search at NEWHR
"For a number of years we saw that professional motivation mattered more than getting a better offer. The market was more or less calm, and an offer well above market was used to offset risks in the offer itself (an outdated stack, risks of the business itself, etc.). In other words, money compensated for the top priorities: opportunities for growth, interesting tasks and so on, but the main factor in the decision was professional fulfilment. Now the economic factor is very strong, and analysts can no longer ignore it when weighing the prospects of staying at their current company or going back to the market."
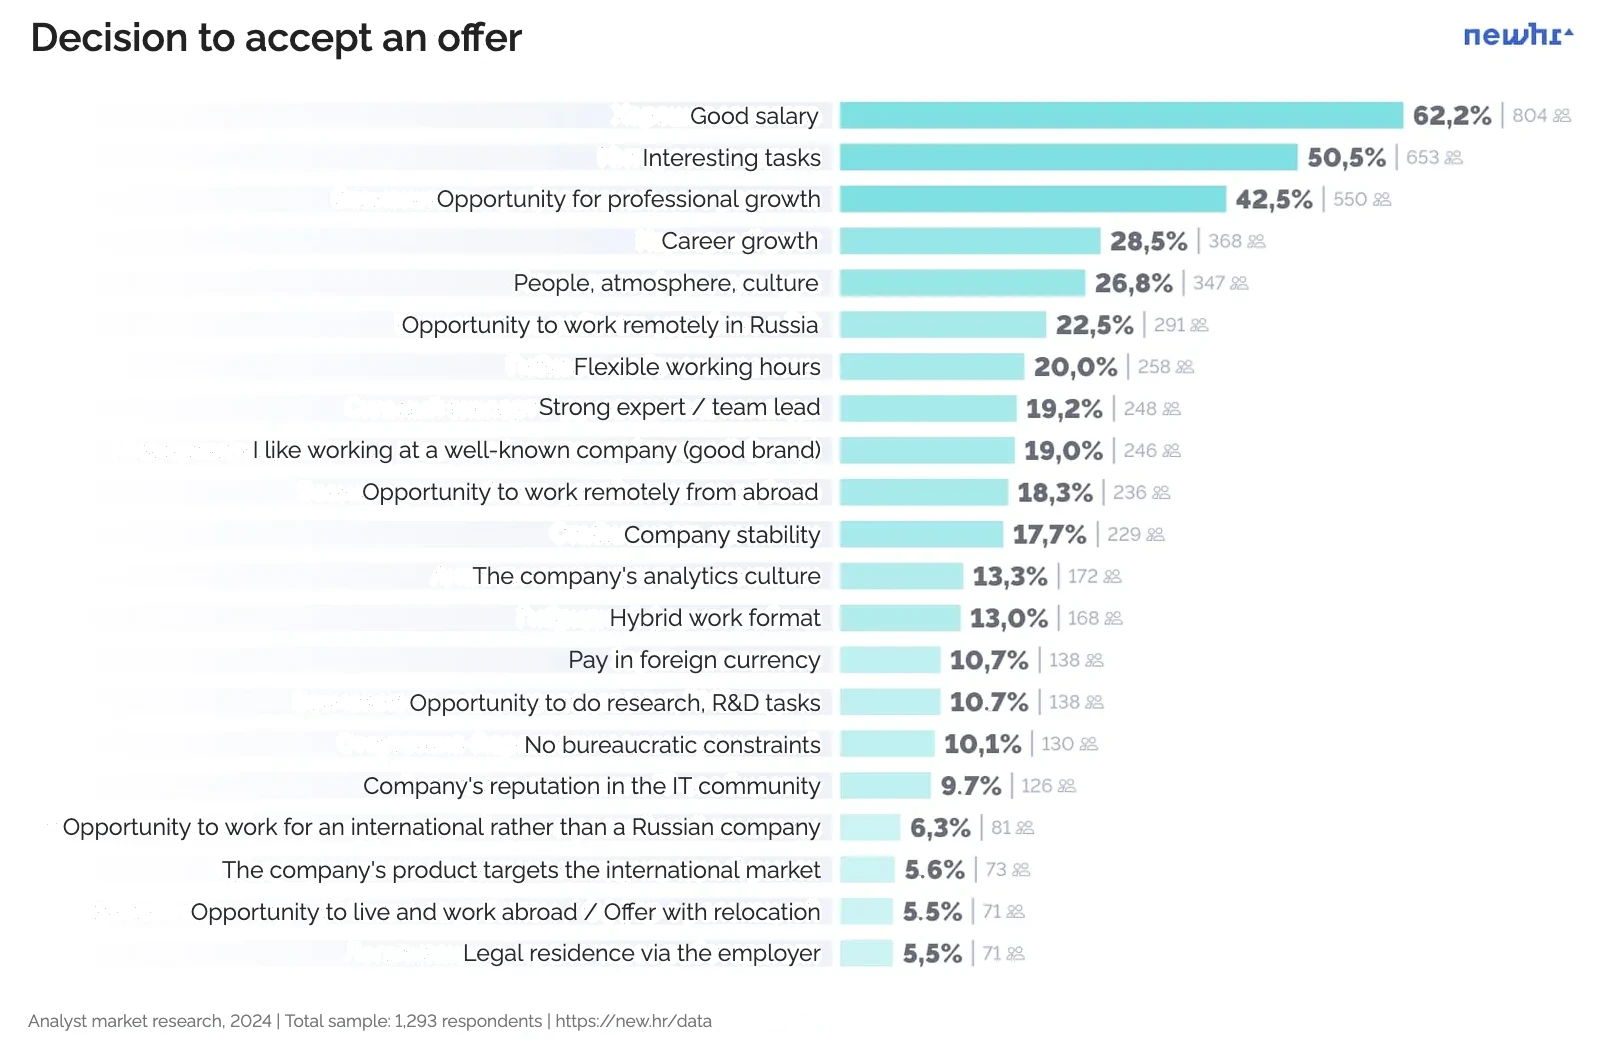
Question: What was the key argument for accepting an offer during your last job search?
*Number of respondents: 1,293
Multiple choice*
When people decide whether to accept a specific offer, salary comes first. This is because by the time they choose an offer, candidates have usually already filtered by other important criteria: company location, work format, salary currency, tasks and so on.
50% of respondents also accept an offer because of interesting tasks. This means that analysts are strongly motivated by professional growth: this factor matters to them as much as money.
Favourite companies
Question: Which companies are you willing to consider offers from in principle?
*Number of respondents: 1,293
Multiple choice*
In 2024 Russian companies became more attractive compared with 2023.
Foreign companies remain attractive to analysts both with the option of relocating abroad (57.7%) and with the hypothetical option of working from Russia (50.6%). But the dynamics matter here.
The preference for Russian companies with the option of working from Russia grew by 11%: from 44.8% in 2023 to 55.9% in 2024.
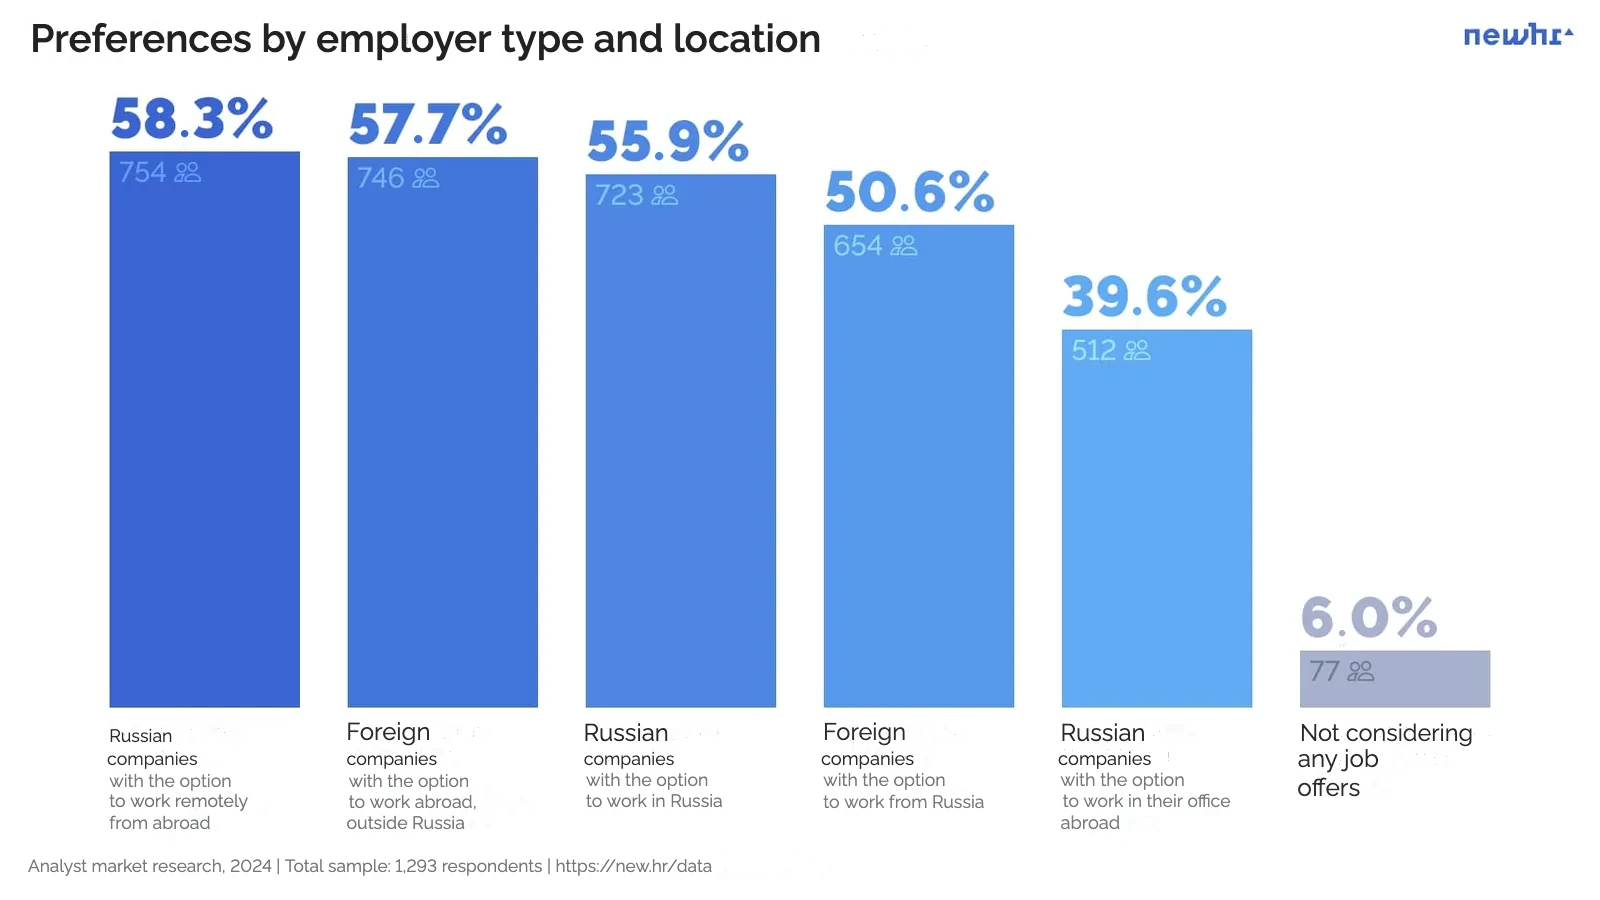
The option that is becoming ever harder to realise, working for a Russian company remotely from abroad, has high and unchanged preference rates (58.3% in 2024 and 58.2% in 2023). It looks more like a dream.
The intermediate option, working for a Russian company with an office abroad, became 9% less attractive (39.6% in 2024 vs. 48.5% in 2023).
Question: Which companies are you willing to consider offers from in principle? By employer company
*Number of respondents: 1,293
Multiple choice*
In 2024 the preference for foreign or Russian companies is strongly linked to the company where the analyst already works.
Analysts working abroad in various arrangements (for "partly Russian", foreign international or foreign local companies) prefer the option of working for foreign companies abroad, which is understandable.
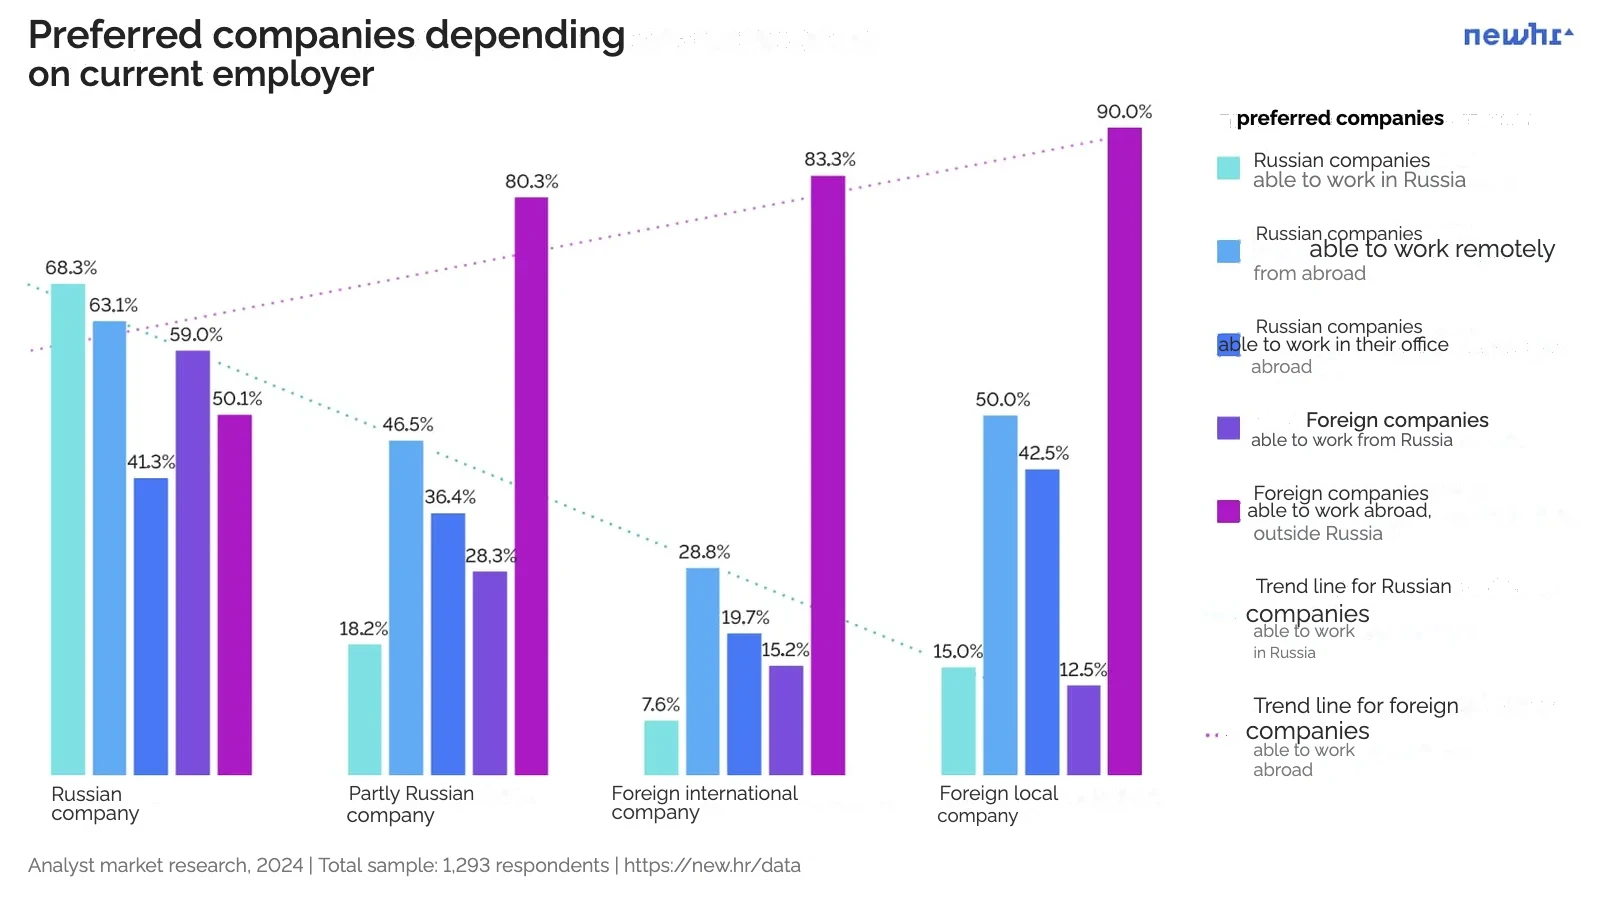
Very important: there is a trend of foreign companies becoming less attractive to analysts in Russian companies, and this breaks the 2022−2023 trend.
Question: Choose 3 companies on the Russian market where you would be happy to consider a job
Number of respondents: 1,293
Question: Name 3 companies where you would definitely not consider a job
Number of respondents: 1,293
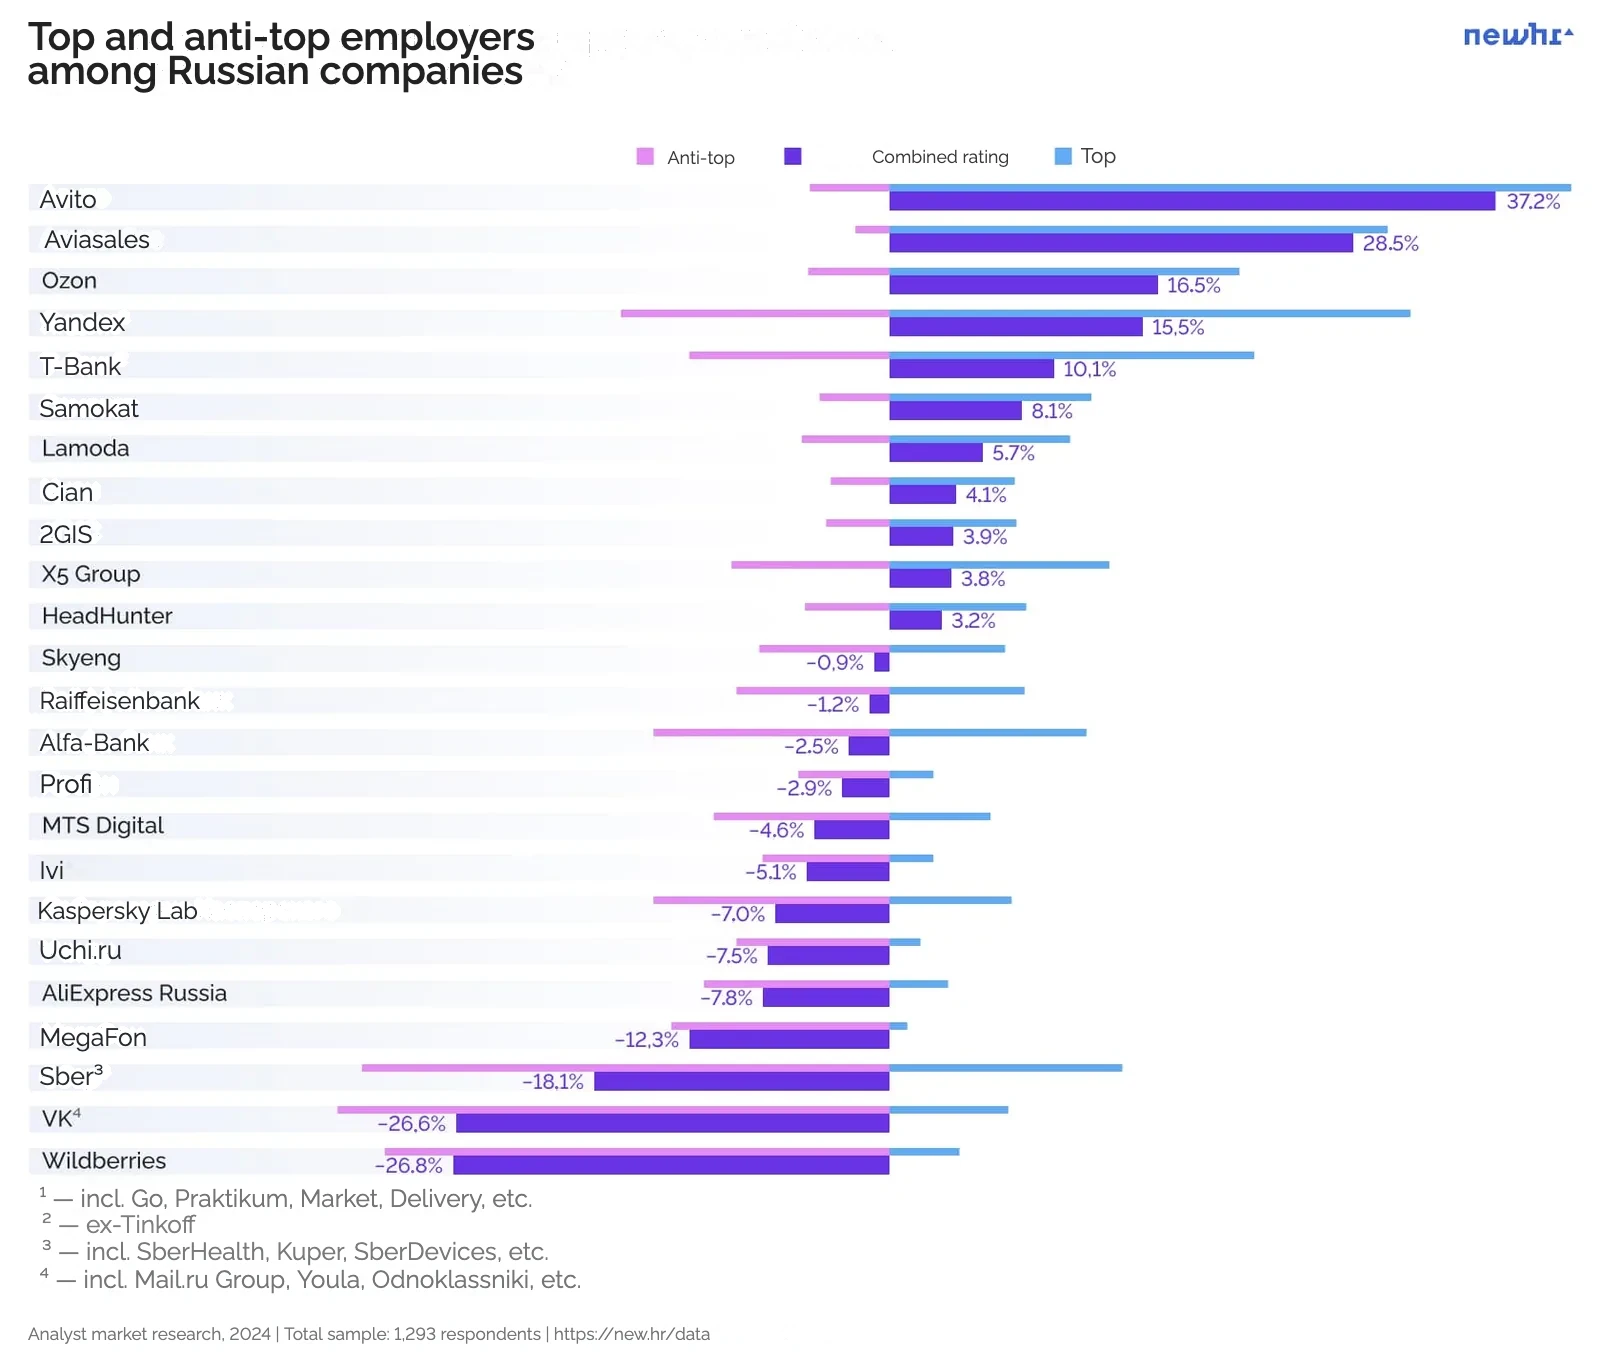
At the end of 2024 Avito became the absolute leader among the best-known Russian companies (42.1%).
- Top 5
- Avito — 42.1%
- Yandex — 32.0%
- Aviasales — 30.6%
- T-Bank — 22.4%
- Ozon — 21.5%
- Anti-top 5
- VK — 33.9%
- Sber — 32.4%
- Wildberries — 31.0%
- Yandex — 16.5%
- Alfa-Bank | Kaspersky Lab — 14.54%
If negative attitudes towards a company outweigh positive ones, it does not mean candidates will ignore its vacancies. However, it may matter when a candidate chooses a specific offer.
For companies in the anti-top, an interview is a good chance to compete for candidates and improve their HR brand. Impressions from interviews at a company can be better than the company's overall HR brand (and vice versa).
Analytics culture
Question: What does a good analytics culture in a company mean to you?
Number of respondents: 1,293
79.3%
- Analysts' work directly affects the product and the business
- 68.7% — The company uses modern analytics tools
62.1%
- Availability and quality of data
54.7%
- A professional analytics community within the company
47.2%
- A high level of automation
.
- .
- 37.4% — The opportunity to independently drive key projects with business impact
- 36.4% — A clear and transparent system of professional and career growth in the company
- 34.5% — The company's analysts share their expertise in the public professional community
The question allowed open answers (36 respondents). They were given most often by Heads and Data analysts. The answers expanded on and specified the characteristics of an analytics culture.
Most often the answers concerned relationships with management and adjacent teams (Analysts' work directly affects the product and the business); good documentation, instructions and templates for routine tasks; well-built pipelines; and a professional community.
Good analytics culture in respondents' quotes
Original spelling and punctuation preserved
"Colleagues have a high level of analytical training: formulating hypotheses, working with data independently"
Good analytics culture in respondents' quotes
Original spelling and punctuation preserved
"The business puts analytics at the forefront and is guided by it when making decisions. That is, analytics is the entry point for development"
Good analytics culture in respondents' quotes
Original spelling and punctuation preserved
"Analytics is asked the right questions, and more often you need to think about the substance than about 'how to explain it in plain language'"
Good analytics culture in respondents' quotes
Original spelling and punctuation preserved
"Minimal distance between analysts and C-level executives: there are joint meetings, you speak the same language, C-level is really ready to hear ideas/objections/arguments/data, respectful communication. The opposite is a large power distance, hierarchy, 'I'm the boss, you're the fool'"
Good analytics culture in respondents' quotes
Original spelling and punctuation preserved
"A transparent, logical system for building the data pipeline, data marts, dashboards. Instructions for routine tasks"
Good analytics culture in respondents' quotes
Original spelling and punctuation preserved
"Good documentation and organisation of analytics tools"
Good analytics culture in respondents' quotes
Original spelling and punctuation preserved
"Colleagues have a high level of analytical training: formulating hypotheses, working with data independently"
Good analytics culture in respondents' quotes
Original spelling and punctuation preserved
"The business puts analytics at the forefront and is guided by it when making decisions. That is, analytics is the entry point for development"
Who analysts follow
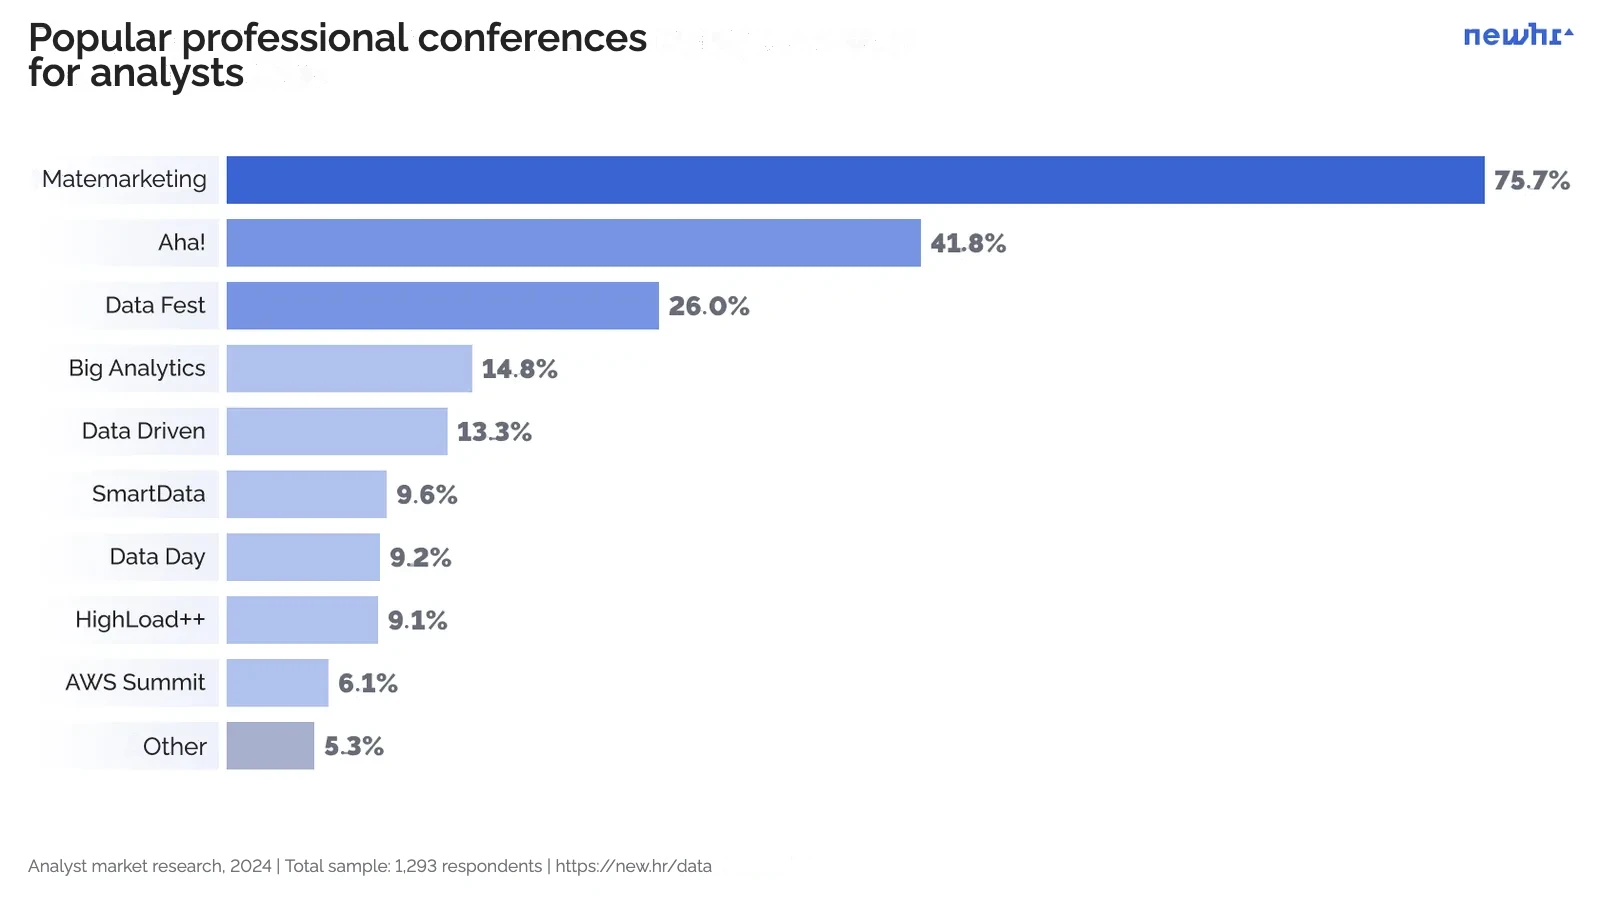
Question: Which data analysis conferences do you attend?
*Number of respondents: 1,293
Multiple choice*
- Matemarketing is attended by 76% of analysts who go to conferences (and 43% of all respondents overall).
- Next come Aha! (42% of conference-goers) and Data Fest (26% of conference-goers).
- The remaining events got less than 15% of regular conference-goers.
Feedback
.
Thank you for your work! I enjoy taking part in your studies and reading the results. You are a great team doing a great thing.
.
Thank you for paying attention to business/systems analysts! We are rarely mentioned when people talk about IT. And in general, I think we are underrated. Why? We also solve hard problems…
.
Good question, the results are interesting. I would like to use them in academic work with a reference to the source
.
A really great list of all the analytics channels and celebs! Thank you, I found new channels for myself. Share this with the world)
.
Thank you for the research, it helps to understand what is happening and where the market is heading.
Our partners
We thank everyone who shared information about the study and helped us collect such an impressive sample! 💙
The list of partners is below. If you helped us find respondents but did not find your channel on the list, write to data@new.hr. If you would like us to correct something in the description, write to us too!
NEWHR
- International recruiting agency
- Hello New Job! — Job search and employment: instructions, tips, useful practices
Recruiting, Cats and the Apocalypse
- The channel of NEWHR founder Kira Kuzmenko
Job for Analysts and Data Scientists
- Vacancies for Digital analysts and Data scientists
Daniil Dzheparov
- Data analyst, author of the Data Study channel
- Natalia Kiseleva — Data visualisation and BI trainer, data artist and data comics creator. Author of the Data-comics and Chatting Charts channels
Gleb Kudryavtsev
- Entrepreneur and product manager, author of the glebkudr channel
- Danila Elistratov — Course author at Skypro and Central University, head of the courses "Fundamentals of statistics" and "Python for data analysis"
- Nastya Kuznetsova — BI and data visualisation expert, author of the "Nastenka and Charts" channel
Roman Romanchuk
- Data analyst, author of the This is Data channel
Alexey Malinsky
- Head of analytics, author of the Malex channel
- Mikhail Garkunov — Digital / Marketing Analyst, author of the "Analytics for Business Decisions" channel
Is This Even Analytics?
- Data analysis
Power BI Design
- UX/UI of analytics reports
Data Pipe
- Data Engineering
Reveal the Data
- BI, analytics and data visualisation
Rational Numbers
- Interesting data and statistics
Product Analytics
- Product analytics
Shuvaeva Valeria
- Data analyst, author of the "World of a Data Analyst" channel
Gavrilov Alexey
- Data analyst, author of the Only Analyst channel
- Elena Ubogoeva — Product analyst, author of the "Statistics and R in Science and Analytics" channel
Daniil Khanin
- CEO of ueCalc, author of the Data Driven Decisions channel
Tanya Misyutina's Data Lab
- Visualisation of complex data, projects and training courses
- Alexey Nikushin — Producer of conferences for analysts, author of the "Internet Analytics" channel
Pavel Bukhtik
- CEO & Founder, author of the No Data No Growth channel
Vanya the Engineer
- Notes on IT and life from Sweden
Andron Aleksanyan
- CEO & founder Simulative/IT Resume
Simulative
- Analytics training
Yuri Borzilo
- Product analytics and A/B tests, author of the "Borzilo" channel
- Alexander Tolmachev — Chief Data Officer (CDO), author of the "Analytics Anonymous Club" channel (@analytics_kaanal)
Valeriy Babushkin
- Senior Principal Data, Data & Analytics
GoPractice
- We teach product management
Filipp Upravitelev
- Product analyst
Mathshub
- International school of Data professions
Iskander Mirmakhmadov
- Expert in A/B testing and data analytics
Alexander Efimov
- Lead product analyst
Dima Varsanovich
- Product analytics team lead, author of the Product analysis channel
Nikolay Valiotti
- CEO and founder of LEFT JOIN
If You Don't Work, You're a Team Lead
The channel about management in IT
Adapted from the original article in Russian on newhr.org. Read the Russian version.